> ## Documentation Index
> Fetch the complete documentation index at: https://docs.costory.io/llms.txt
> Use this file to discover all available pages before exploring further.
# Event Correlations
> Connect cost spikes to the events that caused them
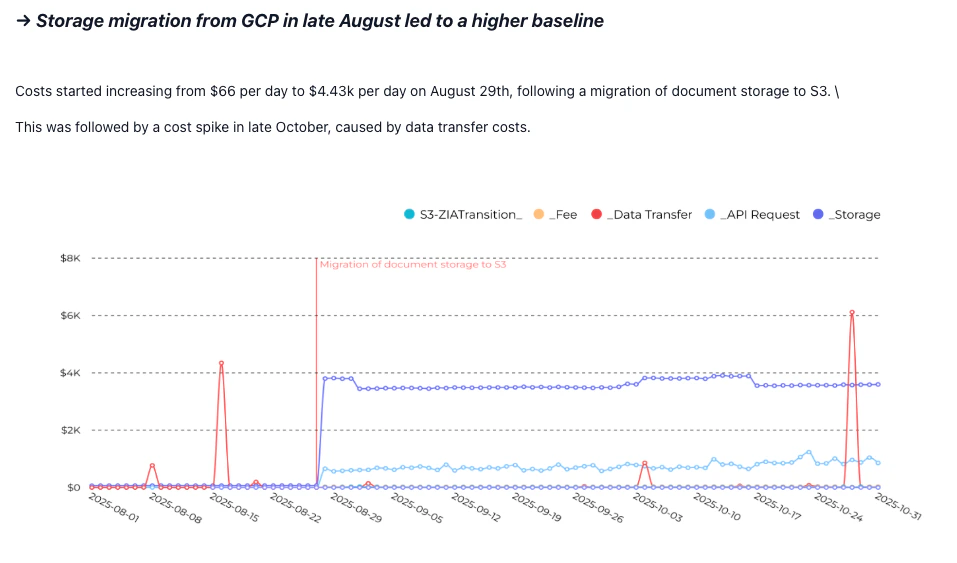
When cloud costs spike, teams scramble to answer: "What changed?" Often the root cause is known (a deployment, new region, or event like Black Friday) but there's no structured correlation between these events and the cost data.
## How Costory Helps
Costory ingests technical and business events and aligns them with cost timelines.
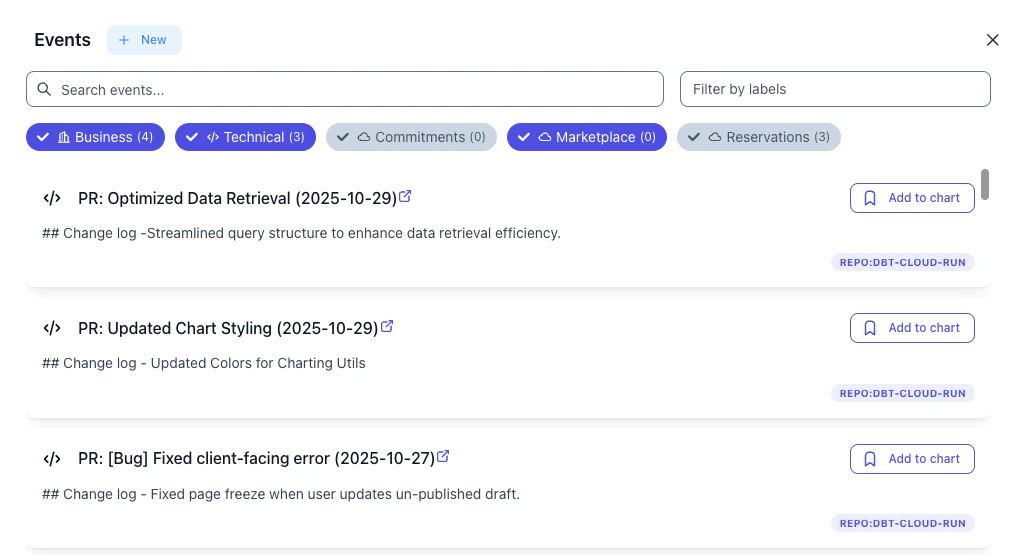 ## Supported Inputs
Savings Plans, Reserved Instances, EDP renewals
PRs, deploys, labels, and release tags
Custom events via API integration
Traffic spikes, client onboarding, campaigns
## Supported Inputs
Savings Plans, Reserved Instances, EDP renewals
PRs, deploys, labels, and release tags
Custom events via API integration
Traffic spikes, client onboarding, campaigns
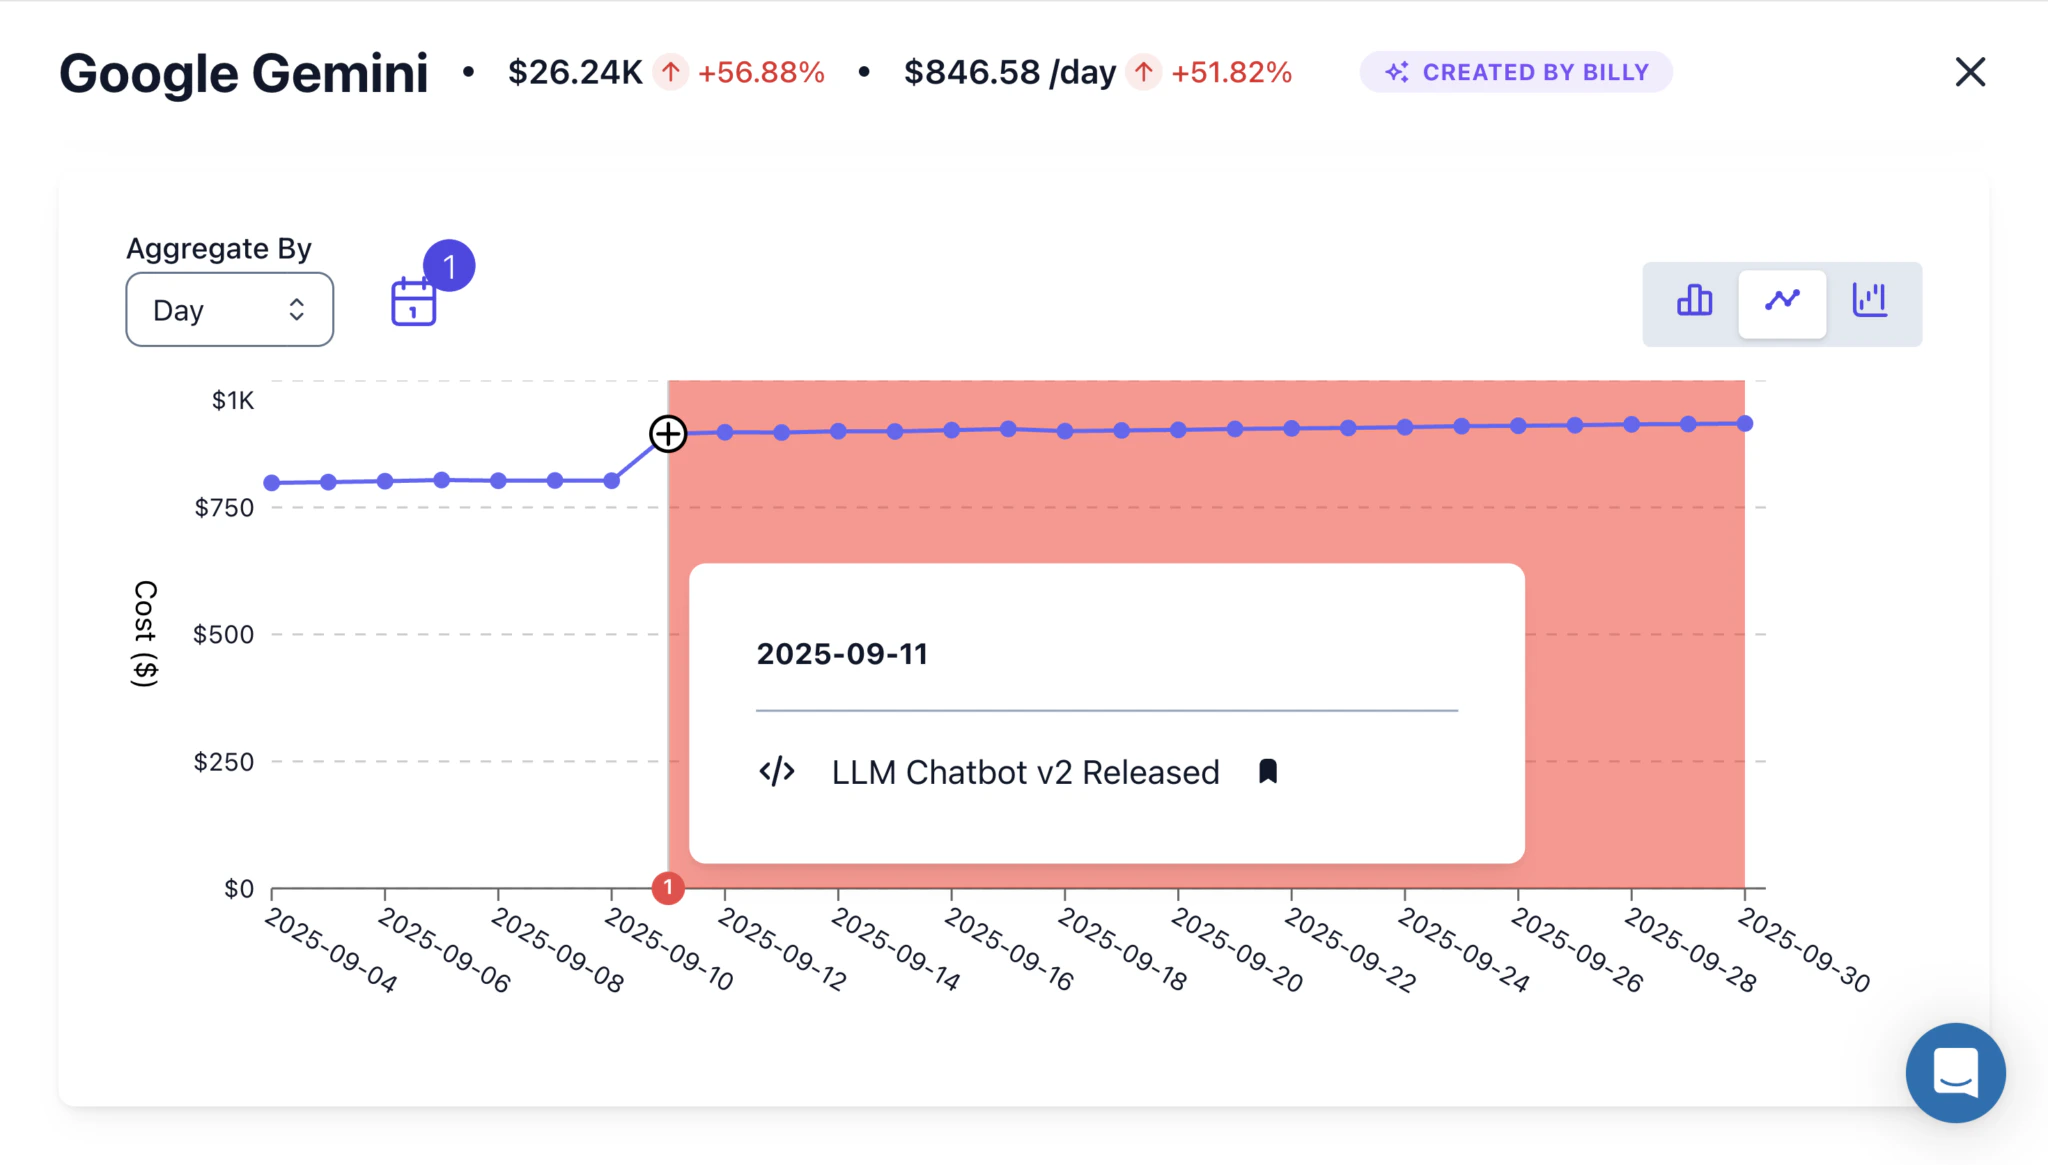 All events are timestamped and visualized alongside cost time series. They also improve the accuracy of Digest summaries and ML-driven anomaly detection.
 ## Benefits
Event-aware timelines speed up investigations
Build shared context across engineering and finance
Improve accuracy of cost change narratives
Increase confidence in anomaly root cause analysis
## Next Steps
Set up your event sources in Costory.
Use event context in automated reports.
## Benefits
Event-aware timelines speed up investigations
Build shared context across engineering and finance
Improve accuracy of cost change narratives
Increase confidence in anomaly root cause analysis
## Next Steps
Set up your event sources in Costory.
Use event context in automated reports.