> ## Documentation Index
> Fetch the complete documentation index at: https://docs.costory.io/llms.txt
> Use this file to discover all available pages before exploring further.
# Automate Monthly Cloud Cost Reporting
> Stop spending days building monthly cloud cost reports. Use Costory's AI-powered Digest to generate executive summaries, root-cause analyses, and shareable reports in minutes.
Every engineering organization faces the same recurring task: reporting on last month's cloud invoice. The formats vary (Notion pages, PowerPoint decks, Slack threads) but the questions remain the same: what happened, why did costs increase, and where are the anomalies.
This work typically falls to senior SREs or infrastructure leads. It's time-consuming, repetitive, and pulls them away from higher-priority engineering work. Costory reduces monthly reporting from half a day (or a full week) down to minutes.
This guide shows you how to automate monthly cloud cost reporting with Costory's AI-powered [Digest](/features/digest).
## Prerequisites
* Your cloud billing data is connected to Costory (see [Quickstart](/get-started/quickstart)).
* Optionally, [events](/setup/events) (deploys, incidents, provider changes) are connected so the AI can reference them in its explanations.
## What you get
* An automated monthly cost breakdown in a tree format, highlighting the biggest movers.
* AI-generated root-cause explanations for each significant change.
* An executive summary ready to share via Notion, Slack, PowerPoint, or email.
## How to automate monthly cost reporting step by step
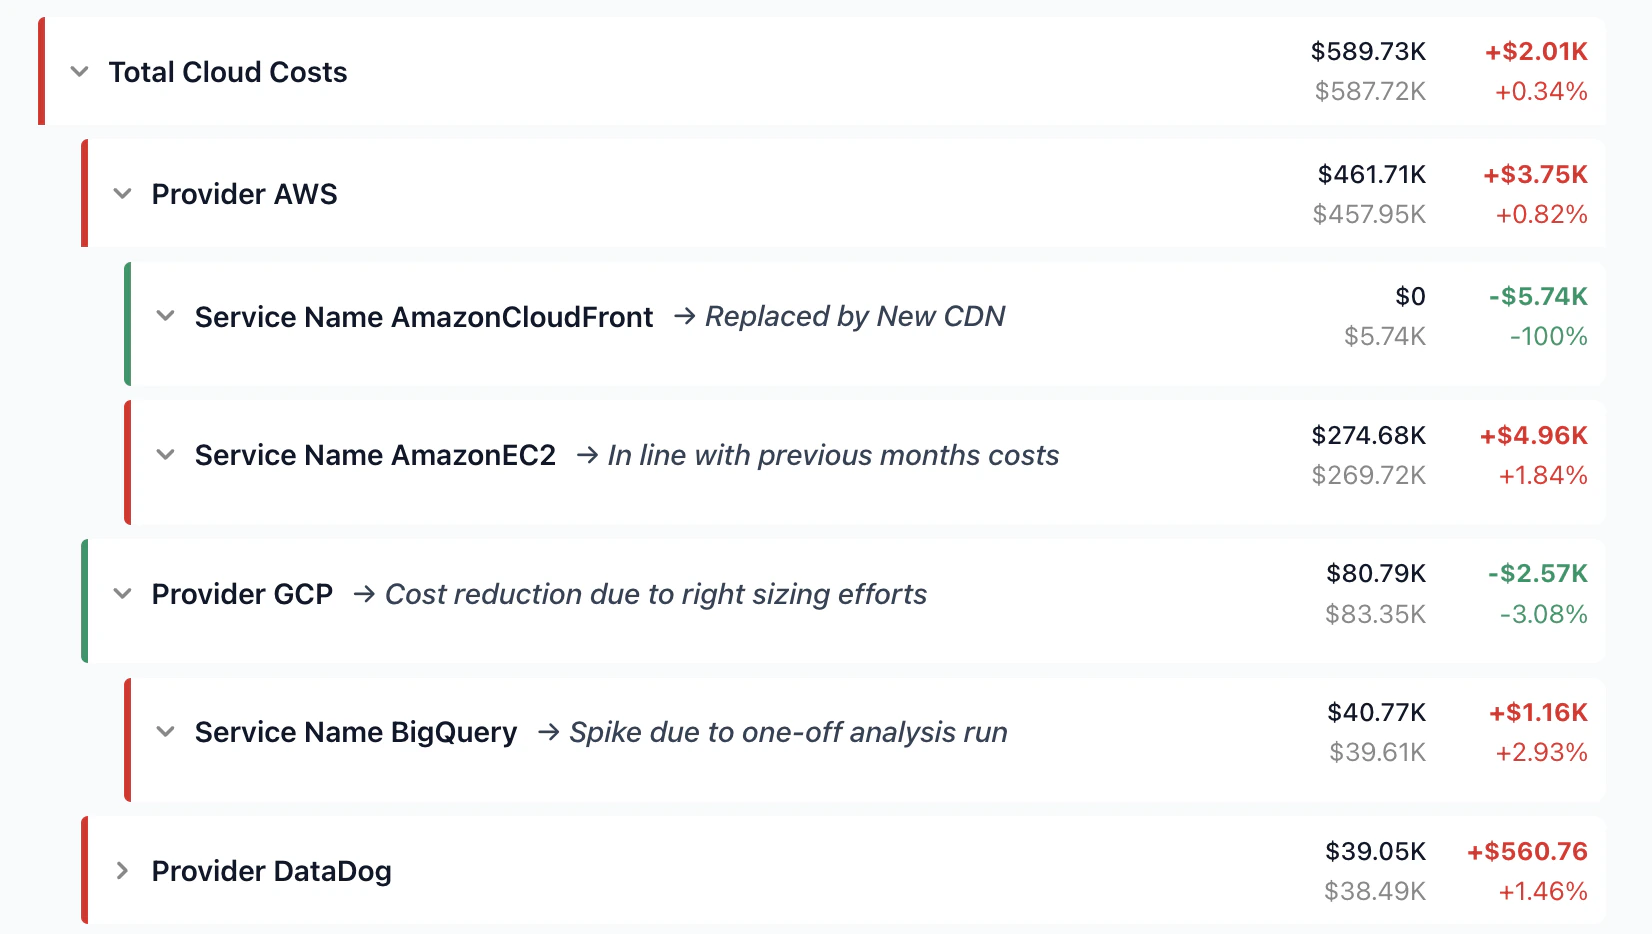
Go to the [Digest](https://app.costory.io/digest) and select the month you want to report on.
The Digest breaks down your monthly costs into an intuitive tree format, highlighting the nodes that moved the most.
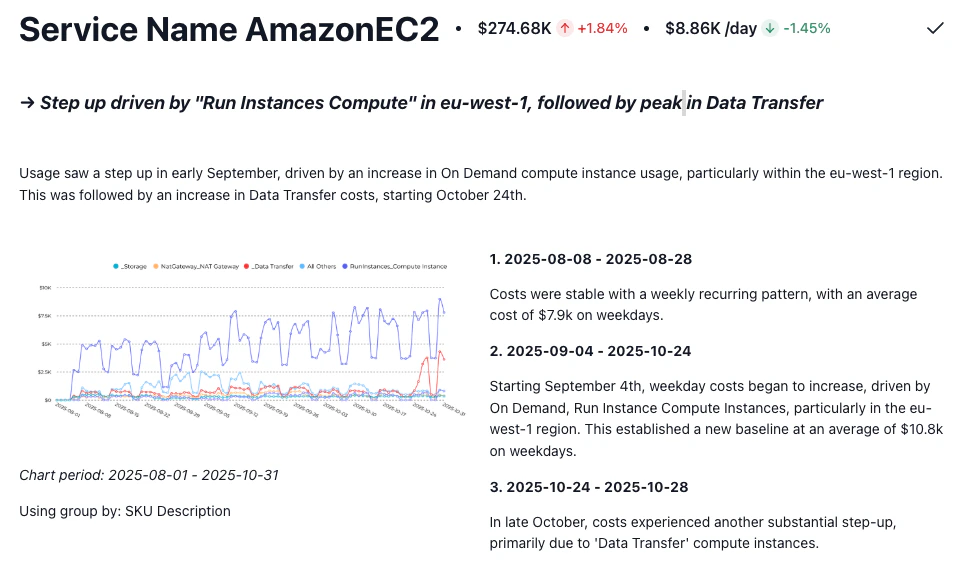
 For each node in the tree, Billy (Costory's AI FinOps assistant) analyzes billing data, usage trends, and incident history to explain what changed and why.
Billy spots anomalies, traces them to root causes, and outputs a structured explanation you can annotate with your own context before sharing.
For each node in the tree, Billy (Costory's AI FinOps assistant) analyzes billing data, usage trends, and incident history to explain what changed and why.
Billy spots anomalies, traces them to root causes, and outputs a structured explanation you can annotate with your own context before sharing.
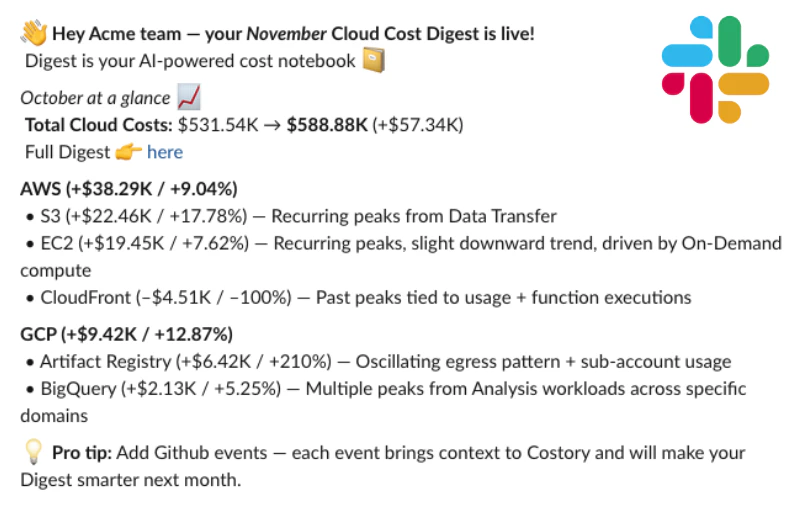
 Costory synthesizes everything into an executive summary. Non-technical stakeholders get self-service access to cost insights, and engineers stay focused on shipping.
Export or share via Notion, Slack, PowerPoint, or email.
Costory synthesizes everything into an executive summary. Non-technical stakeholders get self-service access to cost insights, and engineers stay focused on shipping.
Export or share via Notion, Slack, PowerPoint, or email.
 ## Next steps
* **Add context to your reports**: Connect [events](/setup/events) (deploys, incidents, provider changes) so Billy can reference them in its explanations.
* **Relate costs to usage**: Import [usage metrics](/setup/usage-metrics) to show that cost increases track with business growth. See [Relate Costs to Usage](/automate-reporting/unit-economics).
* **Share per-team reports**: Use [Cost Reports](/features/slack-reports) to give each squad visibility into their own costs. See [Decentralize FinOps](/automate-reporting/decentralize-finops).
## Next steps
* **Add context to your reports**: Connect [events](/setup/events) (deploys, incidents, provider changes) so Billy can reference them in its explanations.
* **Relate costs to usage**: Import [usage metrics](/setup/usage-metrics) to show that cost increases track with business growth. See [Relate Costs to Usage](/automate-reporting/unit-economics).
* **Share per-team reports**: Use [Cost Reports](/features/slack-reports) to give each squad visibility into their own costs. See [Decentralize FinOps](/automate-reporting/decentralize-finops).