> ## Documentation Index
> Fetch the complete documentation index at: https://docs.costory.io/llms.txt
> Use this file to discover all available pages before exploring further.
# Track Unit Economics to Justify Cloud Cost Increases
> Link cloud cost increases to business growth by importing usage metrics into Costory and building unit economics formulas. Defend scaling decisions with data.
Not all cost increases are a problem. More customers, higher traffic, or new workloads will naturally increase cloud spend. But when finance reviews the bill, that nuance is usually lost.
Engineering needs a way to link cost increases to business growth, to show that costs went up because the business grew, not because something broke.
Costory lets you import business and usage metrics into the same interface as your cloud cost data, then define formulas to track unit economics over time. This guide walks you through the process.
## Prerequisites
* Your cloud billing data is connected to Costory (see [Quickstart](/get-started/quickstart)).
* You have access to a business or usage metric (e.g., active users, API calls, transactions) from one of the supported sources: Datadog, BigQuery, Parquet, CSV, or Google Sheets.
## What you get
* Usage metrics imported alongside your cloud cost data.
* Custom unit economics formulas (cost per user, cost per request, cost per transaction, etc.) visualized over time.
* Evidence that cost increases track with business growth, ready to share with finance and leadership.
## How to track unit economics step by step
Bring in the usage data that matters to your business from any supported source:
* **Datadog:** Import metrics directly from your monitoring stack
* **Data warehouses:** BigQuery, Parquet, CSV imports
* **Custom sources:** Spreadsheets, Google Sheets, or APIs for business metrics
See [Usage & Metrics setup](/setup/usage-metrics) for connection details.
 Once the metric is imported, define a formula in [Explorer](/features/cost-explorer) to track the KPIs that matter:
* **Cost per active customer:** track infrastructure efficiency per user
* **Storage cost per document:** monitor storage efficiency at the resource level
* **Lambda cost per OCR job:** measure serverless cost per operation
* **Any custom KPI:** define metrics specific to your business
These metrics can be visualized over time and scoped by team, product, or region.
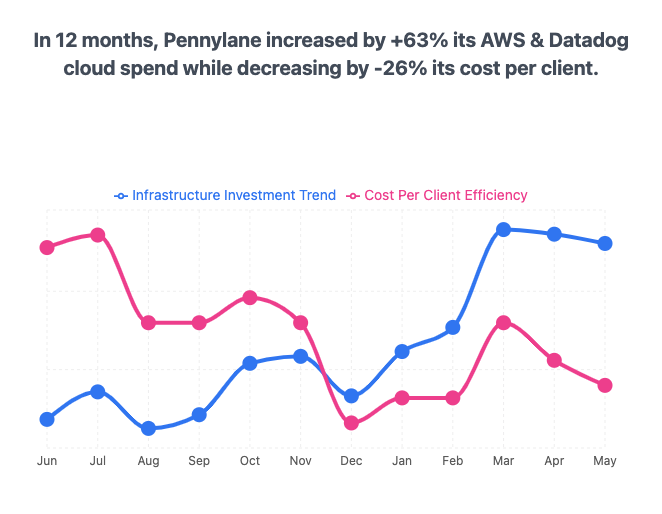
Use the resulting charts to show finance that your cost per user is going *down* even as total spend goes up.
* Include unit economics in your [monthly cost report](/automate-reporting/monthly-reviews). The Digest can reference usage metrics in its AI-generated explanations.
* Share per-team unit economics via [Cost Reports](/features/slack-reports).
* Present the right metrics to leadership. See [FinOps metrics for exec team](/use-cases/what_your_exec_team_wants/value).
## Next steps
* **See a full example:** [Calculate your cost per thousand active users using Amplitude](/use-cases/amplitude/cost_per_active_users)
* **Show leadership the right numbers:** [FinOps metrics for exec team](/use-cases/what_your_exec_team_wants/value)
* **Share per-team reports:** Give each squad visibility into their own costs. See [Decentralize FinOps](/automate-reporting/decentralize-finops).
Once the metric is imported, define a formula in [Explorer](/features/cost-explorer) to track the KPIs that matter:
* **Cost per active customer:** track infrastructure efficiency per user
* **Storage cost per document:** monitor storage efficiency at the resource level
* **Lambda cost per OCR job:** measure serverless cost per operation
* **Any custom KPI:** define metrics specific to your business
These metrics can be visualized over time and scoped by team, product, or region.
Use the resulting charts to show finance that your cost per user is going *down* even as total spend goes up.
* Include unit economics in your [monthly cost report](/automate-reporting/monthly-reviews). The Digest can reference usage metrics in its AI-generated explanations.
* Share per-team unit economics via [Cost Reports](/features/slack-reports).
* Present the right metrics to leadership. See [FinOps metrics for exec team](/use-cases/what_your_exec_team_wants/value).
## Next steps
* **See a full example:** [Calculate your cost per thousand active users using Amplitude](/use-cases/amplitude/cost_per_active_users)
* **Show leadership the right numbers:** [FinOps metrics for exec team](/use-cases/what_your_exec_team_wants/value)
* **Share per-team reports:** Give each squad visibility into their own costs. See [Decentralize FinOps](/automate-reporting/decentralize-finops).