> ## Documentation Index
> Fetch the complete documentation index at: https://docs.costory.io/llms.txt
> Use this file to discover all available pages before exploring further.
# Cloud Cost Dashboards
> Build cloud cost dashboards from Explorer queries to monitor AWS, GCP, and Azure spend, usage metrics, budgets, events, and FinOps KPIs in one place.
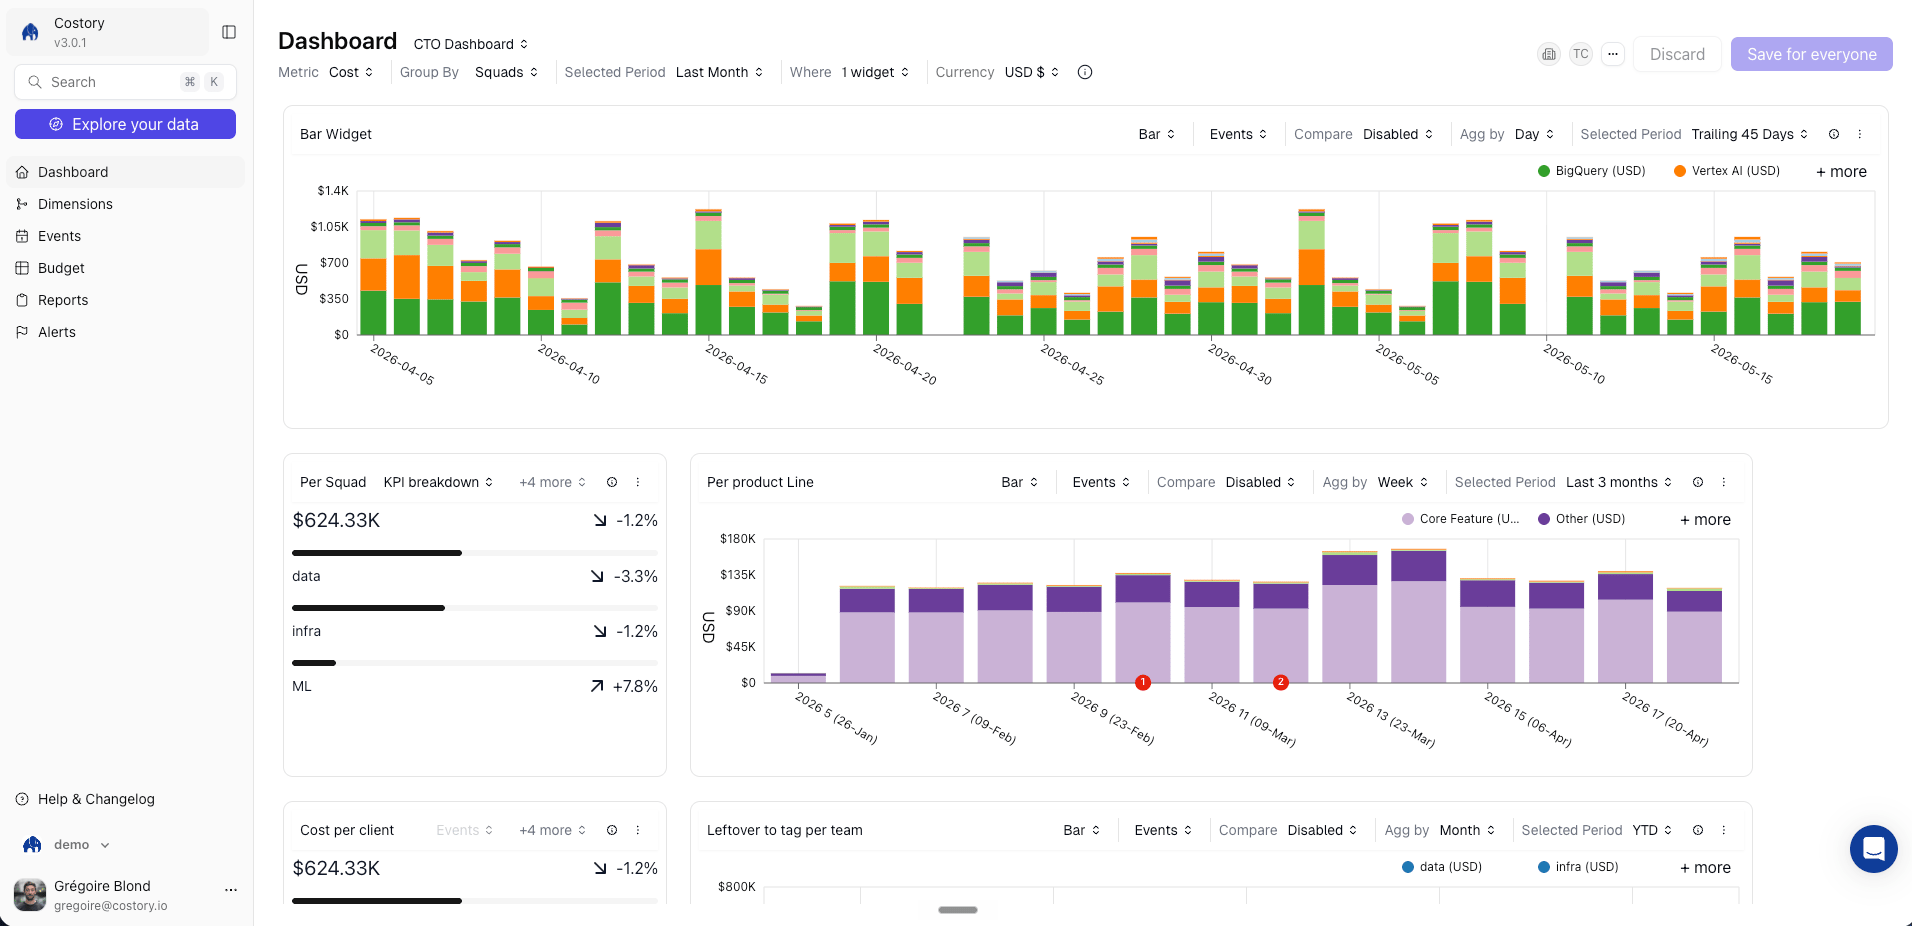
**Cloud cost dashboards** turn Explorer queries into persistent views. Use dashboards when an investigation becomes something a team, service owner, finance partner, or executive stakeholder needs to monitor repeatedly.
 ## Overview
Each dashboard contains one or more widgets. A widget keeps the query context behind it: metric, formula, filters, group-by, selected period, comparison period, and event context.
Use dashboards to:
* Give teams a self-service view of their own spend with showback and chargeback views
* Track executive KPIs such as total spend, top cost drivers, budget progress, and month-over-month movement
* Monitor Savings Plan coverage, Kubernetes waste, unit economics, and other FinOps metrics
* Combine cost data with [usage metrics](/setup/usage-metrics) and [events](/features/events) so teams can explain cost changes from the same page
## Dashboard workflows
Create dashboards from Explorer, add widgets manually, and organize dashboards with tags.
Start from pre-built FinOps dashboards for executives, teams, commitments, Kubernetes, and network costs.
Choose bar, line, waterfall, doughnut, table, budget, and KPI widgets for the right analysis.
Share a dashboard or widget link for ad-hoc collaboration.
## Prerequisites
* At least one cloud provider connected to Costory: [AWS](/setup/billing/aws), [GCP](/setup/billing/gcp), or [Azure](/setup/billing/azure)
* Optional [dimensions](/features/tagging/dimensions) for team, product, environment, or cost-center breakdowns
* Optional [usage metrics](/setup/usage-metrics) for unit economics widgets
* Optional [Teams](/features/teams) for team-owned dashboards and default scopes
## How dashboards relate to Explorer
[Explorer](/features/cost-explorer) is where you investigate a specific question with filters, group-bys, formulas, and comparison periods. Dashboards are where you keep the useful result.
When you save an Explorer query as a dashboard widget, Costory keeps the same query configuration. The widget refreshes as new billing data arrives, so the dashboard stays current without rebuilding the analysis.
## Example dashboard patterns
| Dashboard | Typical widgets |
| ---------------------- | ----------------------------------------------------------------------------- |
| Team cost overview | Cost trend by service, budget progress, top cost drivers, cost per user |
| Executive overview | Total spend, month-over-month change, budget vs actual, top teams or products |
| Commitment coverage | Savings Plan and CUD coverage, uncovered spend, utilization trend |
| Kubernetes cost review | Namespace cost, workload cost, idle or waste indicators, usage ratios |
| Migration tracker | Before-and-after cost trend, event markers, waterfall by service or account |
For ready-made starting points, see [Dashboard templates](/features/dashboards/templates).
## Sharing and delivery
Dashboards support several sharing workflows:
* Send a direct link to a dashboard for logged-in Costory users.
* Use [Quick Share](/features/dashboards/quickshare) for an ad-hoc public link when you need to share outside the normal Costory workflow.
* Schedule a dashboard snapshot as a [Cost Report](/features/slack-reports) to Slack, Microsoft Teams, or email.
* Assign a dashboard to a [Team](/features/teams) so members see the right dashboards by default.
* Copy the widget SQL for BigQuery workflows when your organization uses [BigQuery Data Exports](/setup/destinations/bigquery).
## Frequently asked questions
Yes. Build the query in [Explorer](/features/cost-explorer), then save it as a dashboard widget. See [Create and organize dashboards](/features/dashboards/create-dashboard) for the steps.
Yes. Dashboard widgets can use formulas that combine cloud cost with [usage metrics](/setup/usage-metrics), such as cost per active user or cost per build minute.
Yes. Combine [dimensions](/features/tagging/dimensions), [Shared Cost Allocation](/features/tagging/shared-cost-allocation), budget widgets, and scheduled [Cost Reports](/features/slack-reports) to support chargeback workflows.
Dashboards reflect the latest billing data available in Costory. See [Data Refresh](/docs/data-refresh) for ingestion timing.
## Related links
Build the queries that power dashboard widgets.
Schedule dashboard snapshots to Slack, Teams, or email.
Create team-level and product-level cost groupings.
Set spending targets and track progress on dashboards.
## Overview
Each dashboard contains one or more widgets. A widget keeps the query context behind it: metric, formula, filters, group-by, selected period, comparison period, and event context.
Use dashboards to:
* Give teams a self-service view of their own spend with showback and chargeback views
* Track executive KPIs such as total spend, top cost drivers, budget progress, and month-over-month movement
* Monitor Savings Plan coverage, Kubernetes waste, unit economics, and other FinOps metrics
* Combine cost data with [usage metrics](/setup/usage-metrics) and [events](/features/events) so teams can explain cost changes from the same page
## Dashboard workflows
Create dashboards from Explorer, add widgets manually, and organize dashboards with tags.
Start from pre-built FinOps dashboards for executives, teams, commitments, Kubernetes, and network costs.
Choose bar, line, waterfall, doughnut, table, budget, and KPI widgets for the right analysis.
Share a dashboard or widget link for ad-hoc collaboration.
## Prerequisites
* At least one cloud provider connected to Costory: [AWS](/setup/billing/aws), [GCP](/setup/billing/gcp), or [Azure](/setup/billing/azure)
* Optional [dimensions](/features/tagging/dimensions) for team, product, environment, or cost-center breakdowns
* Optional [usage metrics](/setup/usage-metrics) for unit economics widgets
* Optional [Teams](/features/teams) for team-owned dashboards and default scopes
## How dashboards relate to Explorer
[Explorer](/features/cost-explorer) is where you investigate a specific question with filters, group-bys, formulas, and comparison periods. Dashboards are where you keep the useful result.
When you save an Explorer query as a dashboard widget, Costory keeps the same query configuration. The widget refreshes as new billing data arrives, so the dashboard stays current without rebuilding the analysis.
## Example dashboard patterns
| Dashboard | Typical widgets |
| ---------------------- | ----------------------------------------------------------------------------- |
| Team cost overview | Cost trend by service, budget progress, top cost drivers, cost per user |
| Executive overview | Total spend, month-over-month change, budget vs actual, top teams or products |
| Commitment coverage | Savings Plan and CUD coverage, uncovered spend, utilization trend |
| Kubernetes cost review | Namespace cost, workload cost, idle or waste indicators, usage ratios |
| Migration tracker | Before-and-after cost trend, event markers, waterfall by service or account |
For ready-made starting points, see [Dashboard templates](/features/dashboards/templates).
## Sharing and delivery
Dashboards support several sharing workflows:
* Send a direct link to a dashboard for logged-in Costory users.
* Use [Quick Share](/features/dashboards/quickshare) for an ad-hoc public link when you need to share outside the normal Costory workflow.
* Schedule a dashboard snapshot as a [Cost Report](/features/slack-reports) to Slack, Microsoft Teams, or email.
* Assign a dashboard to a [Team](/features/teams) so members see the right dashboards by default.
* Copy the widget SQL for BigQuery workflows when your organization uses [BigQuery Data Exports](/setup/destinations/bigquery).
## Frequently asked questions
Yes. Build the query in [Explorer](/features/cost-explorer), then save it as a dashboard widget. See [Create and organize dashboards](/features/dashboards/create-dashboard) for the steps.
Yes. Dashboard widgets can use formulas that combine cloud cost with [usage metrics](/setup/usage-metrics), such as cost per active user or cost per build minute.
Yes. Combine [dimensions](/features/tagging/dimensions), [Shared Cost Allocation](/features/tagging/shared-cost-allocation), budget widgets, and scheduled [Cost Reports](/features/slack-reports) to support chargeback workflows.
Dashboards reflect the latest billing data available in Costory. See [Data Refresh](/docs/data-refresh) for ingestion timing.
## Related links
Build the queries that power dashboard widgets.
Schedule dashboard snapshots to Slack, Teams, or email.
Create team-level and product-level cost groupings.
Set spending targets and track progress on dashboards.