> ## Documentation Index
> Fetch the complete documentation index at: https://docs.costory.io/llms.txt
> Use this file to discover all available pages before exploring further.
# Create and Organize Dashboards
> Create cloud cost dashboards from Explorer queries, add widgets manually, duplicate widgets, and organize dashboards with tags and teams.
Create dashboards when a cost question becomes a view you want to revisit. A dashboard can start from an [Explorer](/features/cost-explorer) query, a template, or an empty canvas.
## Create a dashboard from Explorer
Use this workflow when an investigation produces a view worth monitoring.
Open [Explorer](/features/cost-explorer), select the metrics or formulas, apply filters, choose the group-by, and add event context if it helps explain the chart.
Click **Save as dashboard** and choose whether to create a new dashboard or add the view to an existing dashboard.
Rename the widget, choose the visualization, and place it next to related widgets.
The widget keeps the Explorer query and refreshes as new billing data arrives.
If you are starting from a common FinOps workflow, use a [dashboard template](/features/dashboards/templates) instead of building each widget manually.
Skip the canvas entirely: ask the [Costory MCP](/features/mcp) to *"create a dashboard tracking cost per team with a budget widget"* and it builds the widgets for you to review.
## Add a widget manually
Use manual widgets when you already know the metric, grouping, and chart you want.
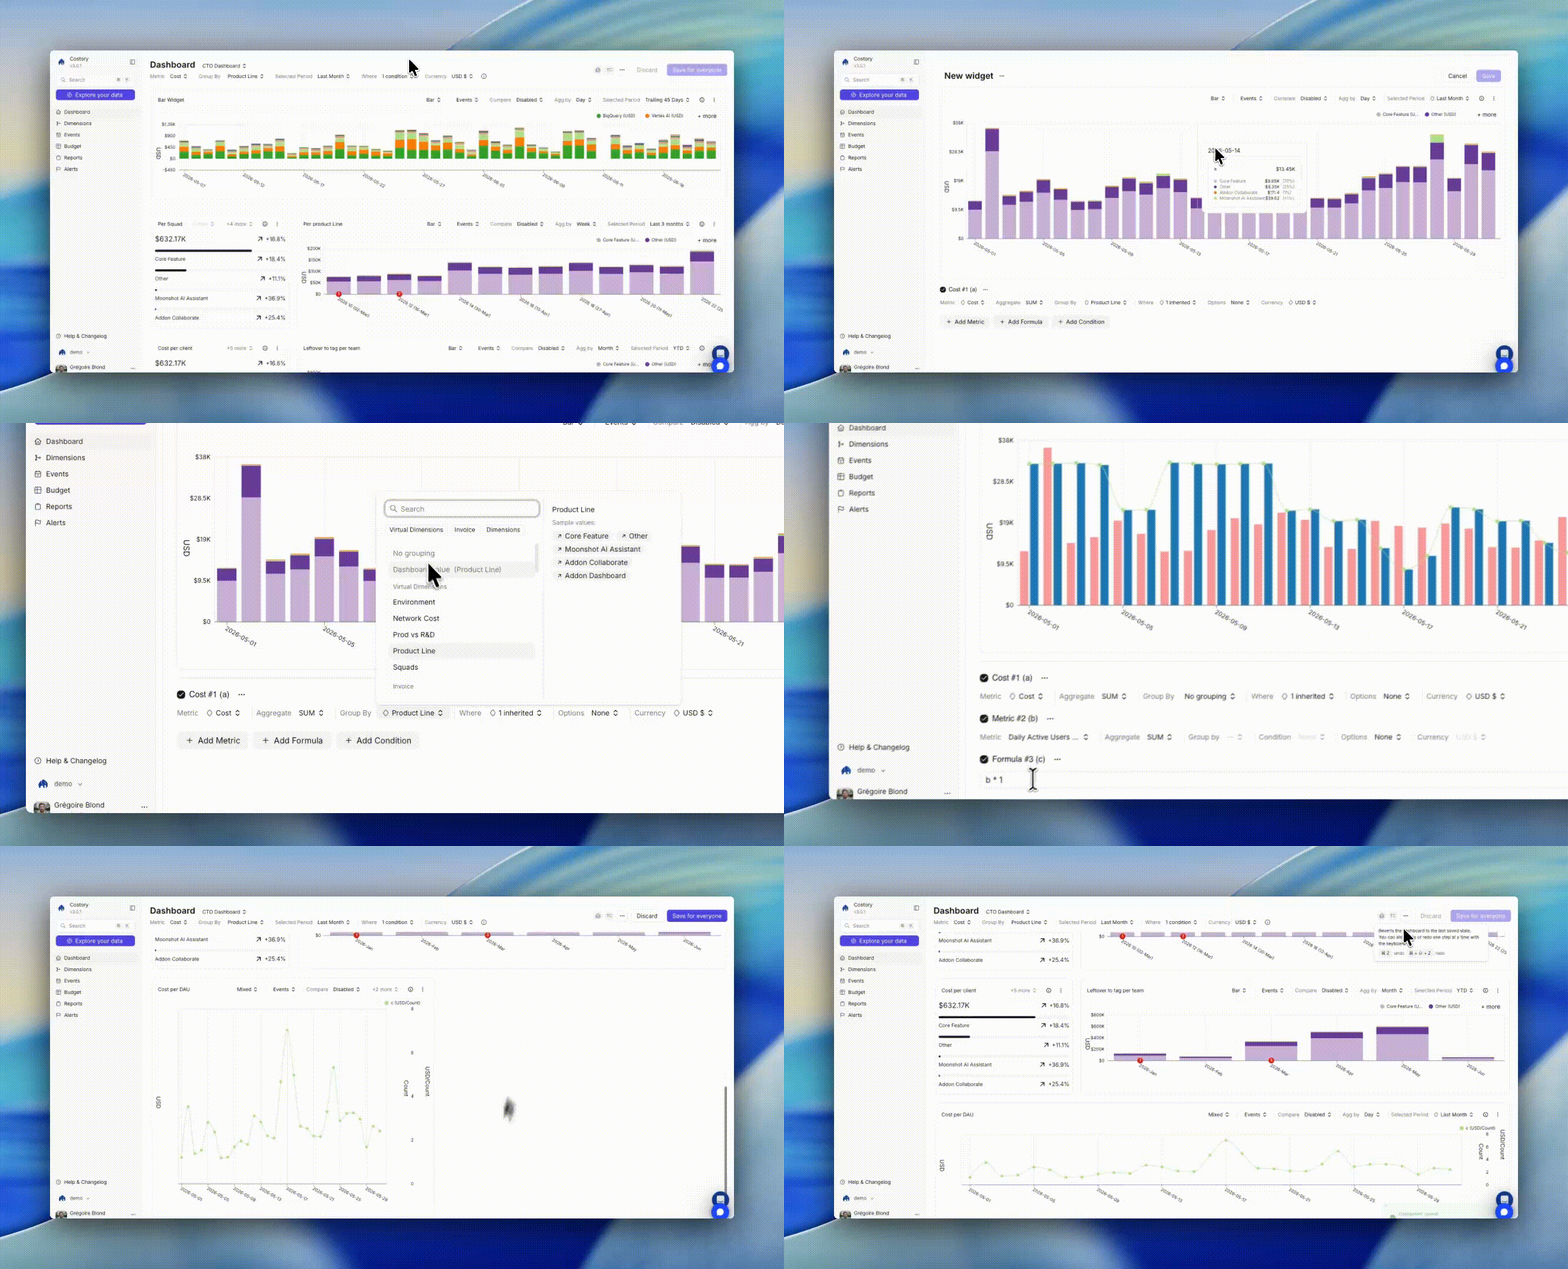 Navigate to an existing dashboard or create a new one.
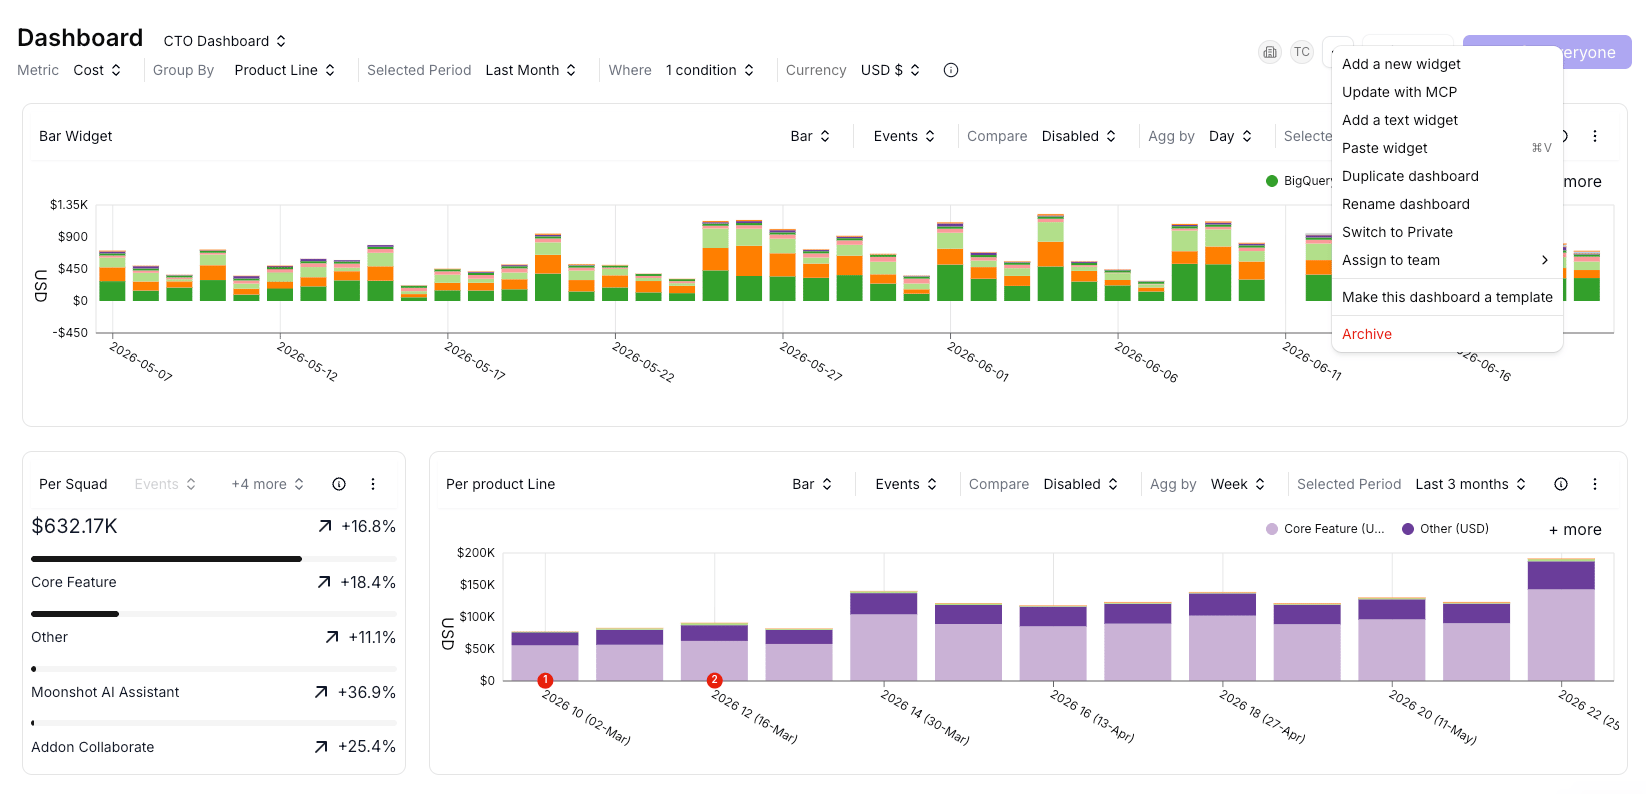
Click **Add Widget** and choose a widget type.
Select the cost metric, filters, group-by, and visualization. You can use any dimension available in Explorer, including [dimensions](/features/tagging/dimensions) and custom formulas.
Click **Save**. The widget updates after each data refresh.
For chart options, see [Widgets and chart types](/features/dashboards/widgets).
## Duplicate a widget
Duplicate widgets when you need the same chart structure with a different filter. For example, duplicate a cost trend widget and swap the team filter to create the same view for another team.
Navigate to an existing dashboard or create a new one.
Click **Add Widget** and choose a widget type.
Select the cost metric, filters, group-by, and visualization. You can use any dimension available in Explorer, including [dimensions](/features/tagging/dimensions) and custom formulas.
Click **Save**. The widget updates after each data refresh.
For chart options, see [Widgets and chart types](/features/dashboards/widgets).
## Duplicate a widget
Duplicate widgets when you need the same chart structure with a different filter. For example, duplicate a cost trend widget and swap the team filter to create the same view for another team.
 ## Organize dashboards with tags
Use dashboard tags to group dashboards by team, workflow, reporting cadence, or FinOps process. Tags appear on the **View all dashboards** page.
## Organize dashboards with tags
Use dashboard tags to group dashboards by team, workflow, reporting cadence, or FinOps process. Tags appear on the **View all dashboards** page.
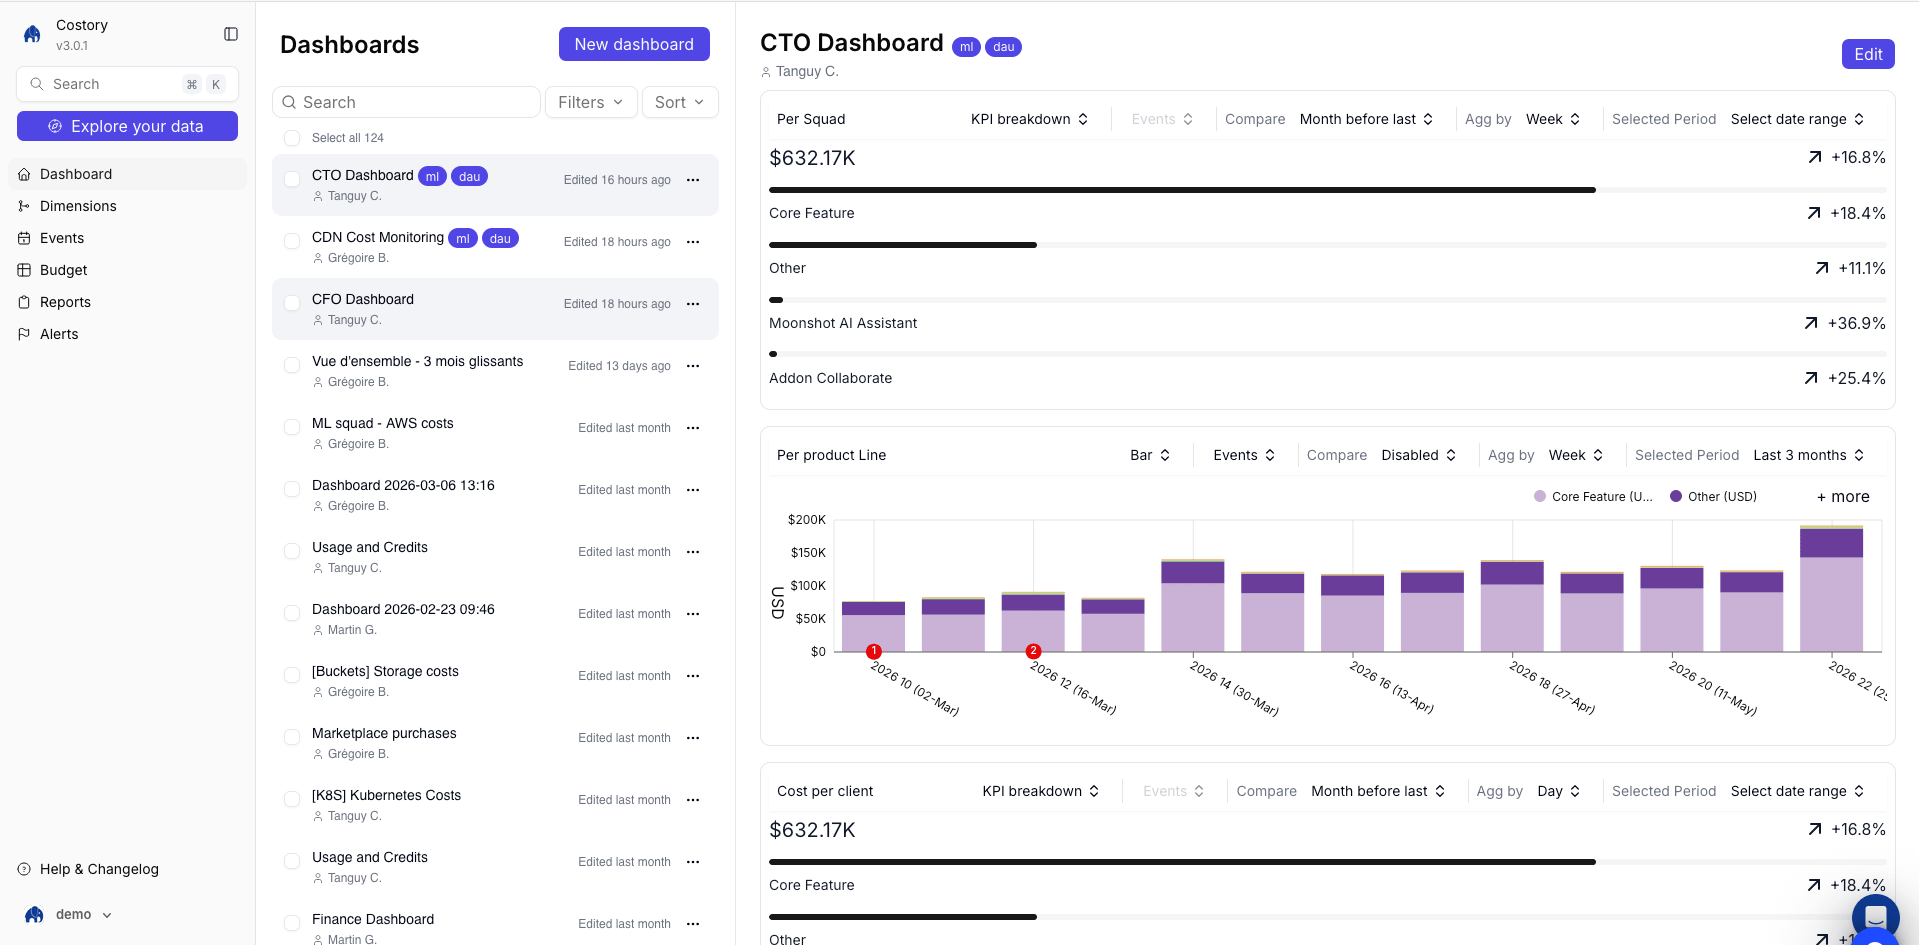 Navigate to **Dashboards** and click **View all dashboards**.
Select one or more dashboards you want to tag.
Click **Edit tags**, add the tags you want, and remove tags that no longer apply.
Save the tag changes. The dashboard list updates with the new tags.
Dashboard tags organize dashboards only. They do not change widget filters, team scopes, or [dimensions](/features/tagging/dimensions).
## Assign dashboards to teams
Assign dashboards to a [Team](/features/teams) when a dashboard belongs to a specific group. Team dashboards appear by default for team members, and private dashboards are restricted to team members.
This is useful for:
* Team showback dashboards
* Product-line dashboards
* Budget owner dashboards
* Platform or SRE dashboards
## Related links
Start from common FinOps dashboard layouts.
Choose the right widget for each cost question.
Share dashboard context with teammates or external collaborators.
Deliver dashboards to Slack, Teams, or email on a schedule.
Navigate to **Dashboards** and click **View all dashboards**.
Select one or more dashboards you want to tag.
Click **Edit tags**, add the tags you want, and remove tags that no longer apply.
Save the tag changes. The dashboard list updates with the new tags.
Dashboard tags organize dashboards only. They do not change widget filters, team scopes, or [dimensions](/features/tagging/dimensions).
## Assign dashboards to teams
Assign dashboards to a [Team](/features/teams) when a dashboard belongs to a specific group. Team dashboards appear by default for team members, and private dashboards are restricted to team members.
This is useful for:
* Team showback dashboards
* Product-line dashboards
* Budget owner dashboards
* Platform or SRE dashboards
## Related links
Start from common FinOps dashboard layouts.
Choose the right widget for each cost question.
Share dashboard context with teammates or external collaborators.
Deliver dashboards to Slack, Teams, or email on a schedule.