> ## Documentation Index
> Fetch the complete documentation index at: https://docs.costory.io/llms.txt
> Use this file to discover all available pages before exploring further.
# Dashboard Templates
> Use pre-built FinOps dashboard templates for executive cloud cost reporting, team showback, Savings Plan coverage, Kubernetes cost allocation, network costs, and storage optimization.
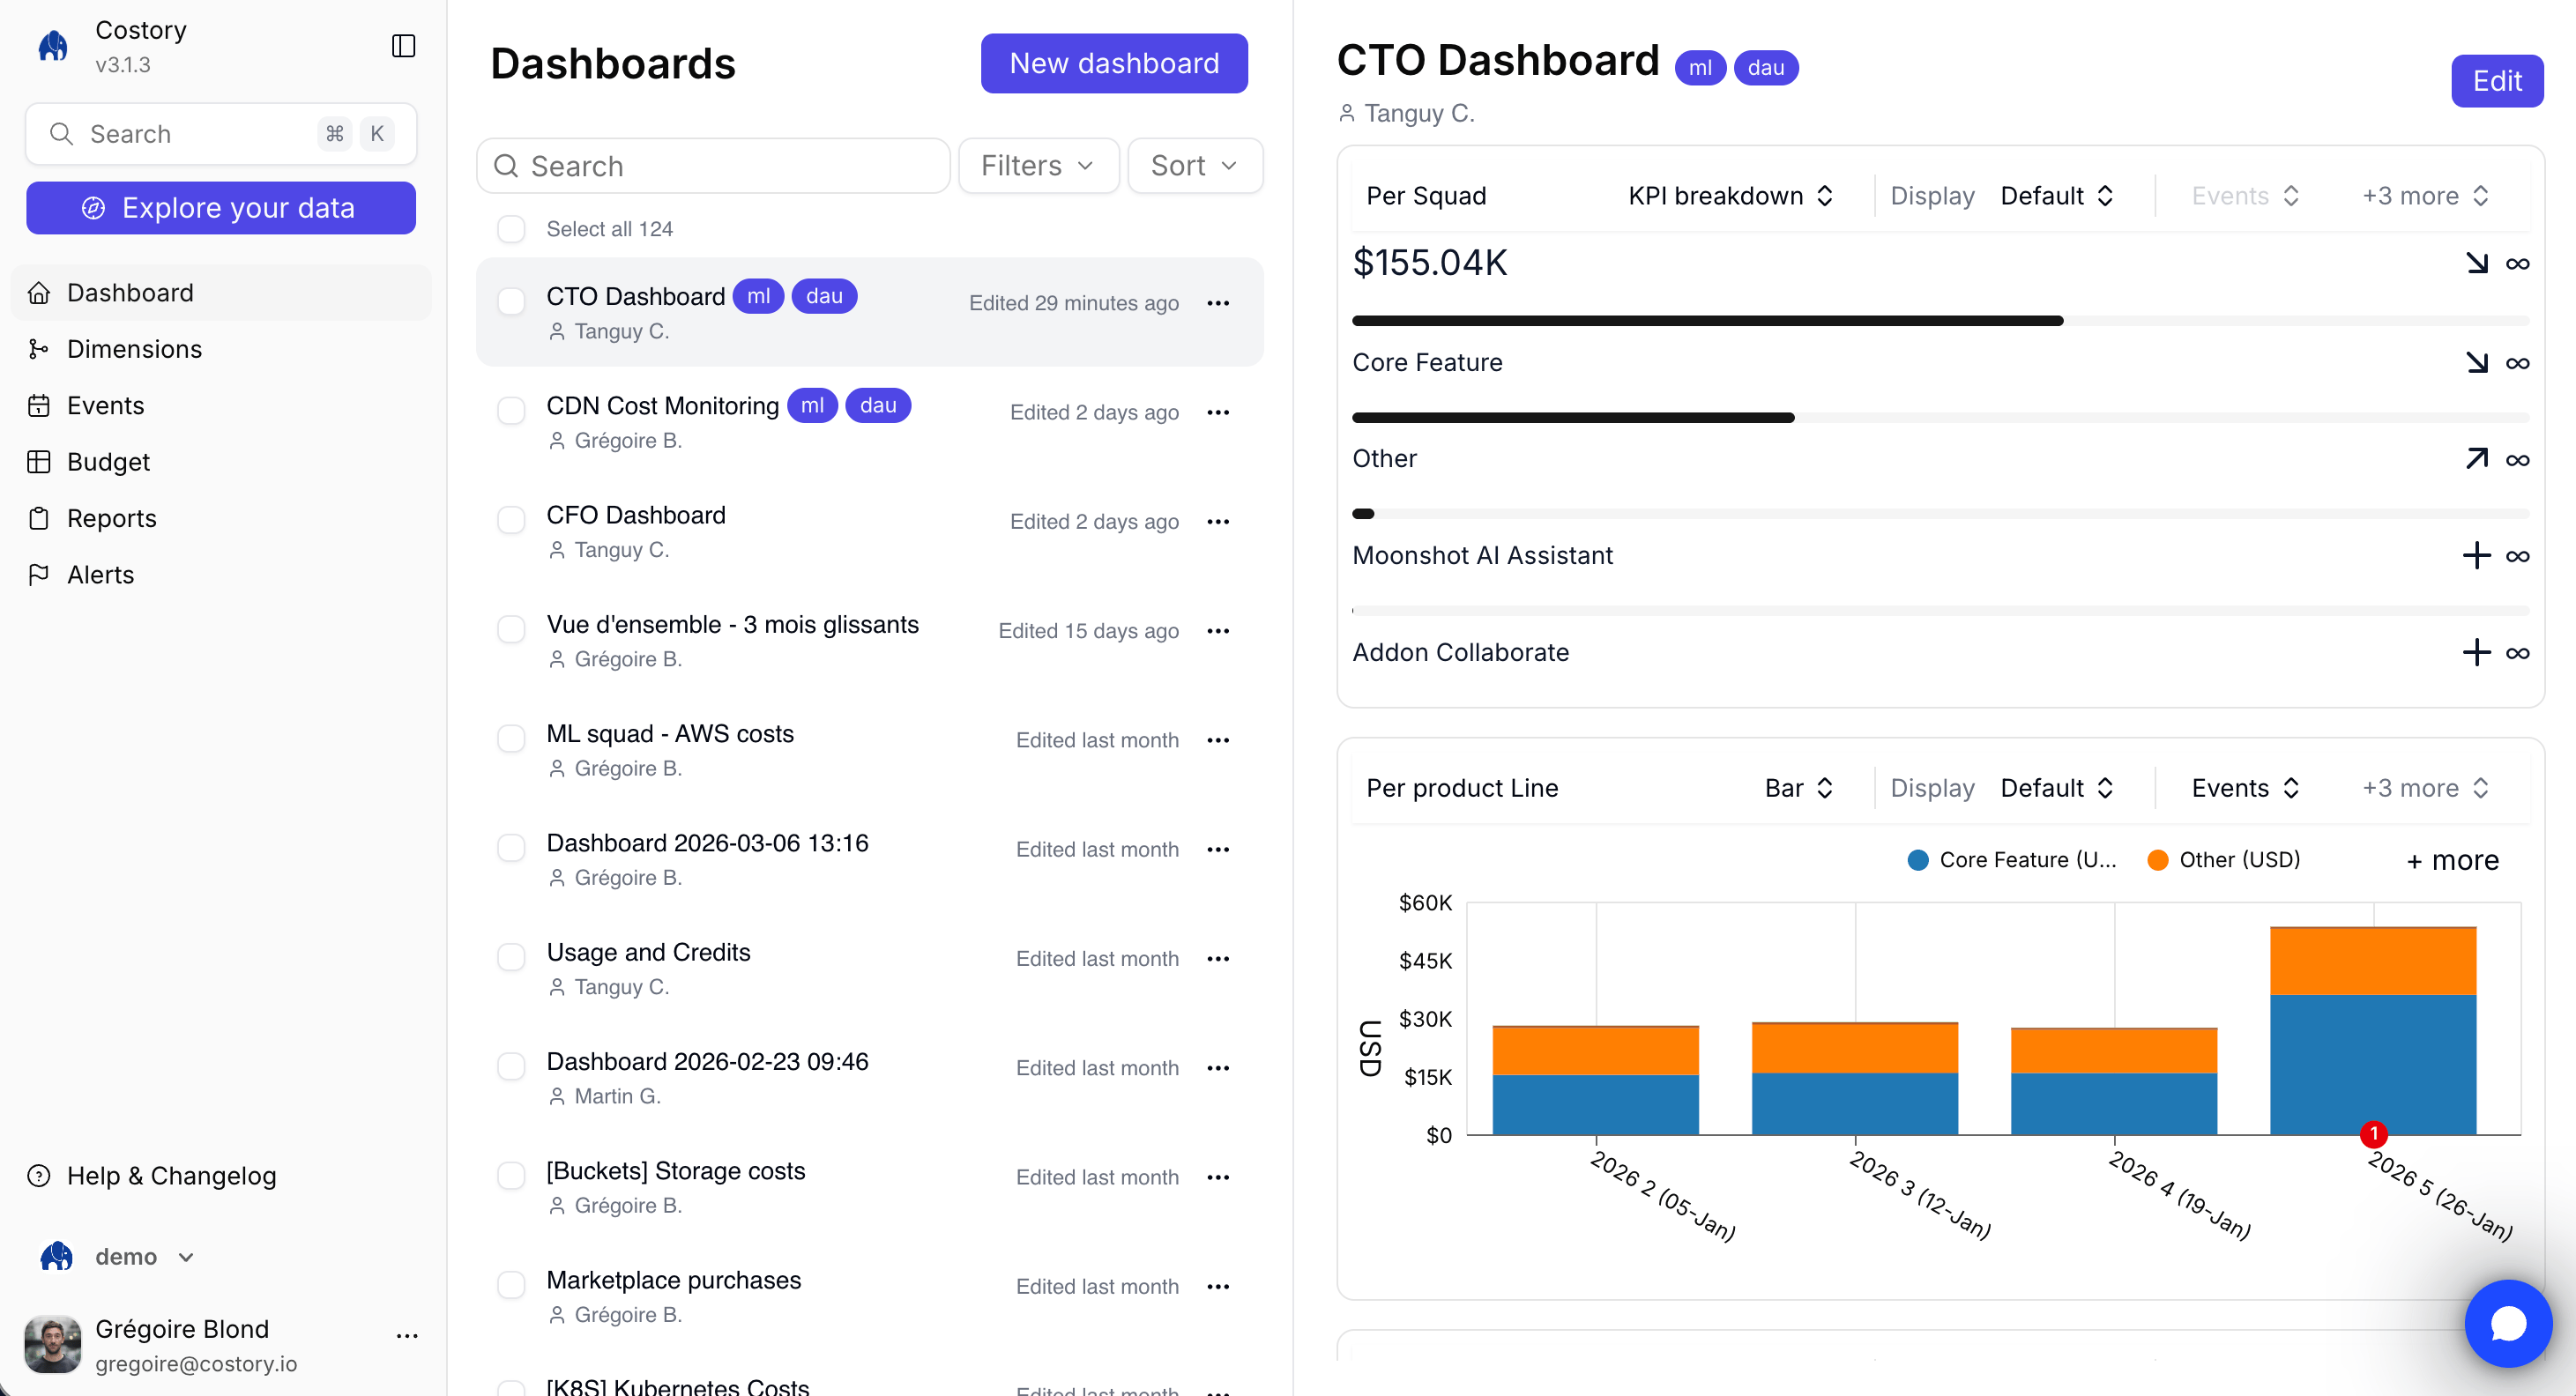
Dashboard templates give you a starting point for common FinOps workflows. Each template creates a dashboard with preconfigured widgets, filters, group-bys, and comparison periods that use your connected billing data.
 ## When to use templates
Use a template when you want a working dashboard without deciding every widget first. After creating the dashboard, edit any widget to change the metric, chart type, filter, group-by, or date range.
Templates are useful for:
* Creating a repeatable dashboard for each team or product line
* Starting a monthly cost review without rebuilding the same charts
* Monitoring commitment coverage, Kubernetes costs, or network costs with standard FinOps views
* Giving executives a concise page with top cost drivers and budget movement
## Available templates
| Template | What it tracks |
| ----------------------------- | -------------------------------------------------------------------------------------------------------------------------------------------------- |
| CTO / Executive overview | Total spend trend, top cost drivers, budget progress, and month-over-month comparison |
| Team cost overview | Per-team spend scoped by [dimensions](/features/tagging/dimensions), service breakdown, budget progress, and cost efficiency metrics |
| Savings Plan and CUD coverage | Covered vs uncovered spend, utilization rate, and coverage trend for commitment planning |
| Kubernetes cost breakdown | Cost by cluster, namespace, workload, and waste indicator. See [EKS cost allocation](/use-cases/eks-cost-allocation). |
| Network cost analysis | Cross-AZ, egress, and transfer cost drivers by provider, service, account, or team |
| BigQuery cost attribution | BigQuery spend by project, dbt model, package, or team. See [BigQuery and dbt visibility](/use-cases/dbt_bigquery_visibility/increase_visibility). |
| Storage cost optimization | Unattached volumes, underused disks, backup growth, and high-cost storage classes |
## Create a dashboard from a template
Navigate to **Dashboards**.
Click **Create Dashboard**.
Select the template that matches your workflow.
Costory creates the dashboard with widgets populated from your connected billing data.
Edit filters, group-bys, chart types, date ranges, and labels so the dashboard matches your organization.
## Apply team scopes
Team templates work best when your [dimensions](/features/tagging/dimensions) already map cloud resources to owners. Create one team dashboard, verify the layout, then duplicate it and swap the team filter for each additional team.
You can also use [Teams](/features/teams) to assign dashboards to team members and apply default scopes.
## Template follow-ups
After you create a template dashboard, you can:
* Add or replace widgets with [dashboard widgets](/features/dashboards/widgets)
* Send a public link with [Quick Share](/features/dashboards/quickshare)
* Schedule the dashboard as a [Cost Report](/features/slack-reports)
* Create an [alert](/features/alerts) from the same query logic when a KPI needs monitoring
## Related links
Build dashboards from Explorer or an empty canvas.
Customize the widgets created by a template.
Configure team, product, or environment groupings before using team templates.
Break down Kubernetes costs by namespace, workload, and pod.
## When to use templates
Use a template when you want a working dashboard without deciding every widget first. After creating the dashboard, edit any widget to change the metric, chart type, filter, group-by, or date range.
Templates are useful for:
* Creating a repeatable dashboard for each team or product line
* Starting a monthly cost review without rebuilding the same charts
* Monitoring commitment coverage, Kubernetes costs, or network costs with standard FinOps views
* Giving executives a concise page with top cost drivers and budget movement
## Available templates
| Template | What it tracks |
| ----------------------------- | -------------------------------------------------------------------------------------------------------------------------------------------------- |
| CTO / Executive overview | Total spend trend, top cost drivers, budget progress, and month-over-month comparison |
| Team cost overview | Per-team spend scoped by [dimensions](/features/tagging/dimensions), service breakdown, budget progress, and cost efficiency metrics |
| Savings Plan and CUD coverage | Covered vs uncovered spend, utilization rate, and coverage trend for commitment planning |
| Kubernetes cost breakdown | Cost by cluster, namespace, workload, and waste indicator. See [EKS cost allocation](/use-cases/eks-cost-allocation). |
| Network cost analysis | Cross-AZ, egress, and transfer cost drivers by provider, service, account, or team |
| BigQuery cost attribution | BigQuery spend by project, dbt model, package, or team. See [BigQuery and dbt visibility](/use-cases/dbt_bigquery_visibility/increase_visibility). |
| Storage cost optimization | Unattached volumes, underused disks, backup growth, and high-cost storage classes |
## Create a dashboard from a template
Navigate to **Dashboards**.
Click **Create Dashboard**.
Select the template that matches your workflow.
Costory creates the dashboard with widgets populated from your connected billing data.
Edit filters, group-bys, chart types, date ranges, and labels so the dashboard matches your organization.
## Apply team scopes
Team templates work best when your [dimensions](/features/tagging/dimensions) already map cloud resources to owners. Create one team dashboard, verify the layout, then duplicate it and swap the team filter for each additional team.
You can also use [Teams](/features/teams) to assign dashboards to team members and apply default scopes.
## Template follow-ups
After you create a template dashboard, you can:
* Add or replace widgets with [dashboard widgets](/features/dashboards/widgets)
* Send a public link with [Quick Share](/features/dashboards/quickshare)
* Schedule the dashboard as a [Cost Report](/features/slack-reports)
* Create an [alert](/features/alerts) from the same query logic when a KPI needs monitoring
## Related links
Build dashboards from Explorer or an empty canvas.
Customize the widgets created by a template.
Configure team, product, or environment groupings before using team templates.
Break down Kubernetes costs by namespace, workload, and pod.