> ## Documentation Index
> Fetch the complete documentation index at: https://docs.costory.io/llms.txt
> Use this file to discover all available pages before exploring further.
# AI-Powered Cloud Cost Digest with Anomaly Detection
> Automatically surface and triage the cloud cost changes that matter. Digest ranks every significant cost shift by dollar impact and generates AI incident reports with root cause analysis.
Cloud bills contain millions of line items with no sense of priority. **Digest** surfaces only the cost changes that matter, ranked by real dollar impact, with AI-generated explanations for each one.
 ## Overview
Digest analyzes your cloud bill at the end of each period and produces a ranked breakdown of every significant cost change. Each change gets an AI-generated incident report from Billy that explains what happened, what caused it, and whether it correlates with known events like deploys or pricing changes.
Where it fits in your day-to-day:
* Replacing manual monthly cost reviews with an automated, shareable report. See the [monthly reporting guide](/automate-reporting/monthly-reviews).
* Triaging cost anomalies before they become surprises in the next invoice
* Giving executive stakeholders a summary they can read without digging into dashboards
## Key terms used in this article
* **Cost Breakdown Tree**: The hierarchical structure Digest uses to organize cost data. You configure which dimensions form each level (e.g., Provider > Account > Service). Nodes auto-expand based on cost impact.
* **Billy**: Costory's AI FinOps assistant that analyzes billing data, detects anomalies, and generates incident reports for each node in the tree.
* **Node**: A single segment in the cost breakdown tree (e.g., a specific AWS account or GCP service). Each node shows a summary of the cost change and its total dollar impact.
* **View**: A saved [Explorer](/features/cost-explorer) configuration. You can feed saved views into Digest for automated analysis.
See the [Glossary](/docs/glossary) for a full list of terms.
## Get started
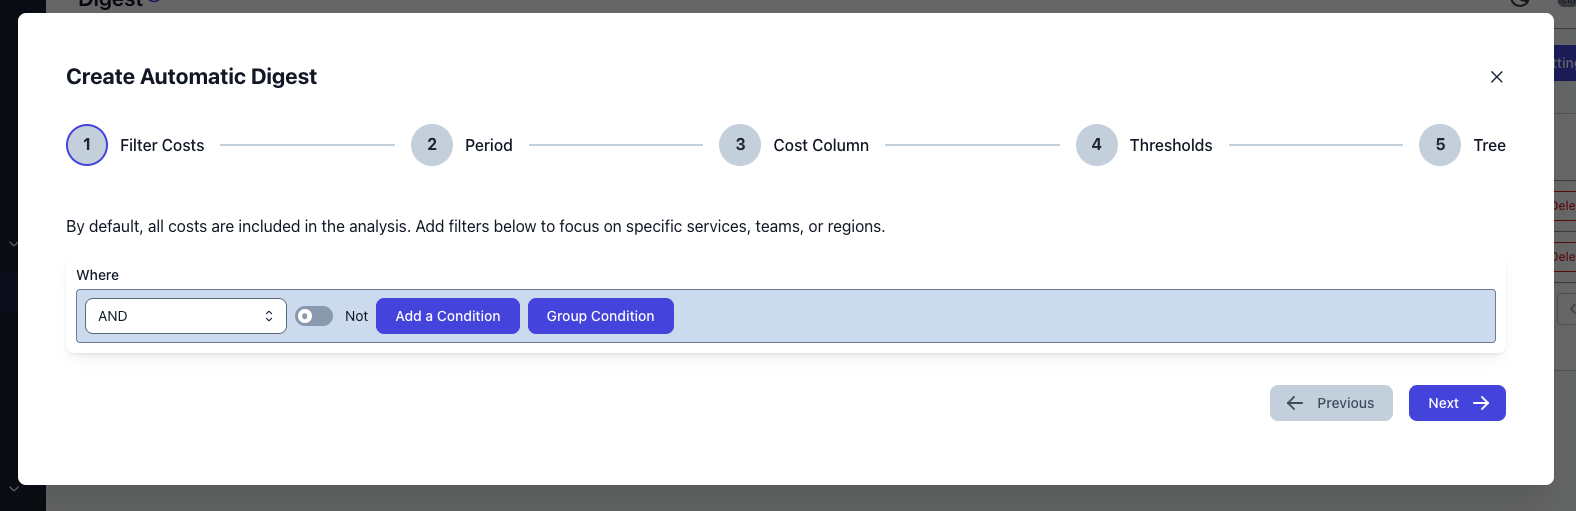
Set up how Digest breaks down your costs. You can change this configuration at any time.
The time window to analyze
The comparison period to measure changes against
The dimensions that form each level of the breakdown. You can use standard columns or Dimensions to split costs by team, product, or environment.
Digest produces a tree of all cost changes, ranked by total dollar impact. Nodes auto-expand and auto-collapse based on their relevance, so you see the biggest movers first.
## Overview
Digest analyzes your cloud bill at the end of each period and produces a ranked breakdown of every significant cost change. Each change gets an AI-generated incident report from Billy that explains what happened, what caused it, and whether it correlates with known events like deploys or pricing changes.
Where it fits in your day-to-day:
* Replacing manual monthly cost reviews with an automated, shareable report. See the [monthly reporting guide](/automate-reporting/monthly-reviews).
* Triaging cost anomalies before they become surprises in the next invoice
* Giving executive stakeholders a summary they can read without digging into dashboards
## Key terms used in this article
* **Cost Breakdown Tree**: The hierarchical structure Digest uses to organize cost data. You configure which dimensions form each level (e.g., Provider > Account > Service). Nodes auto-expand based on cost impact.
* **Billy**: Costory's AI FinOps assistant that analyzes billing data, detects anomalies, and generates incident reports for each node in the tree.
* **Node**: A single segment in the cost breakdown tree (e.g., a specific AWS account or GCP service). Each node shows a summary of the cost change and its total dollar impact.
* **View**: A saved [Explorer](/features/cost-explorer) configuration. You can feed saved views into Digest for automated analysis.
See the [Glossary](/docs/glossary) for a full list of terms.
## Get started
Set up how Digest breaks down your costs. You can change this configuration at any time.
The time window to analyze
The comparison period to measure changes against
The dimensions that form each level of the breakdown. You can use standard columns or Dimensions to split costs by team, product, or environment.
Digest produces a tree of all cost changes, ranked by total dollar impact. Nodes auto-expand and auto-collapse based on their relevance, so you see the biggest movers first.
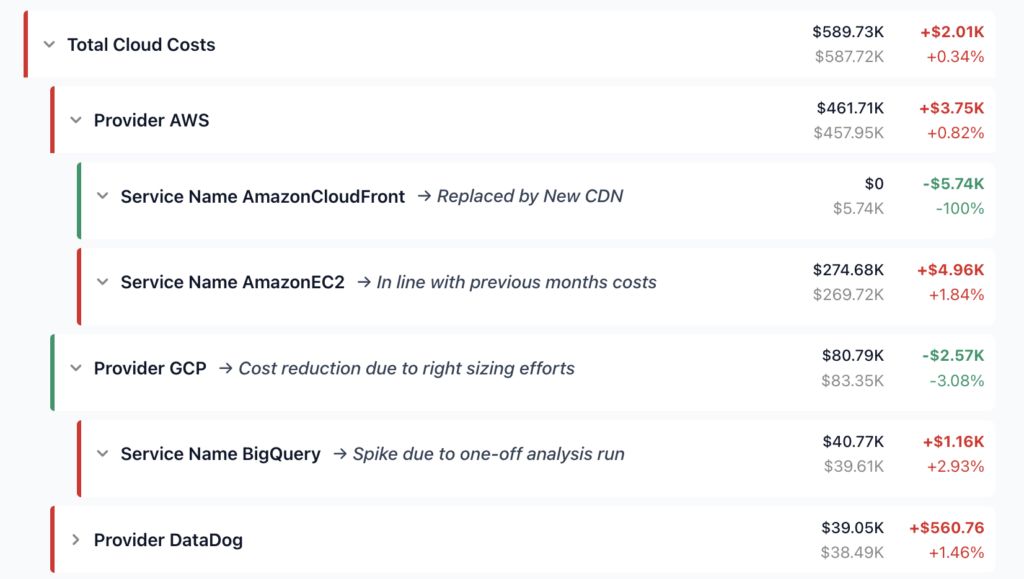 Each node includes a one-line summary and the total cost change. Click any node to open its detailed incident report.
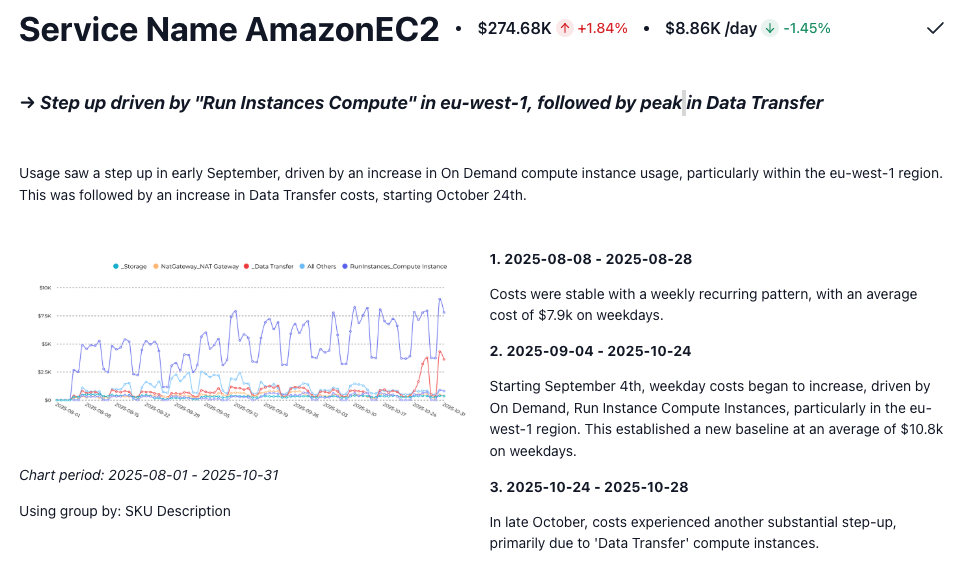
For each node, Billy generates a cost incident report that breaks down the change into:
* **Step changes:** sudden shifts in cost level
* **Trends:** gradual increases or decreases over time
* **Events:** correlated deploys, pricing changes, or custom events
* **Root causes:** the specific resources or configurations driving the change
Each node includes a one-line summary and the total cost change. Click any node to open its detailed incident report.
For each node, Billy generates a cost incident report that breaks down the change into:
* **Step changes:** sudden shifts in cost level
* **Trends:** gradual increases or decreases over time
* **Events:** correlated deploys, pricing changes, or custom events
* **Root causes:** the specific resources or configurations driving the change
 You can edit any Billy-generated report to add your own context and annotations before sharing.
Configure Digest to run automatically on a schedule. Costory generates the report in the background and delivers it when ready, so the entire process is hands-off after the initial setup.
You can edit any Billy-generated report to add your own context and annotations before sharing.
Configure Digest to run automatically on a schedule. Costory generates the report in the background and delivers it when ready, so the entire process is hands-off after the initial setup.
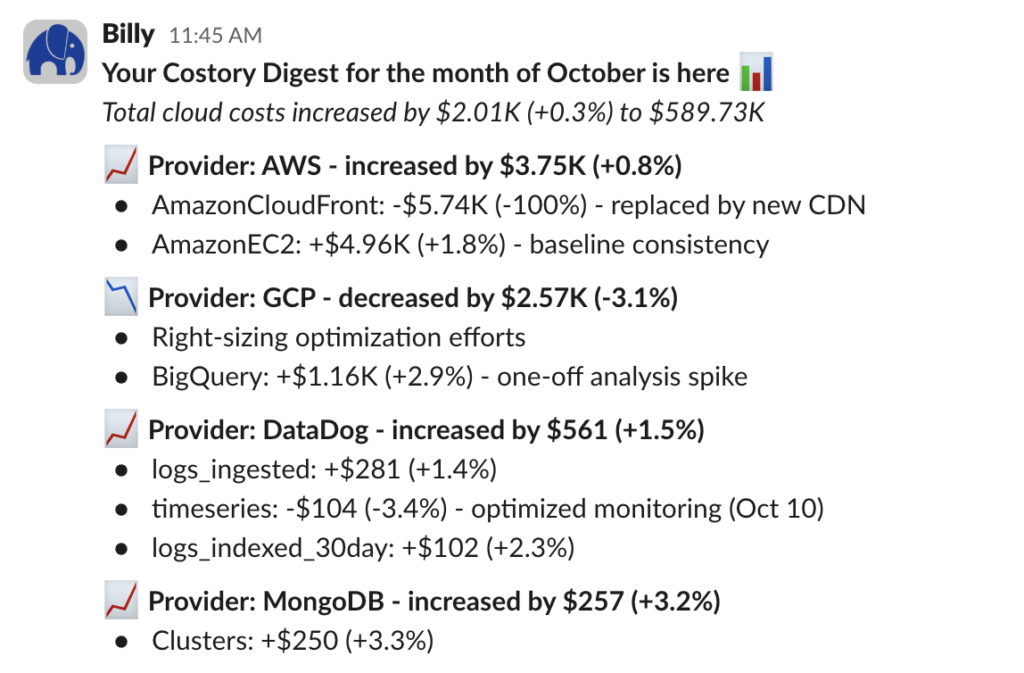
 Share a preview of the Digest via Slack or Microsoft Teams. Your team gets a summary of the biggest cost changes without needing to log into Costory.
 ## Use cases
### Monthly cost reviews
Configure Digest with `[Provider, Account, Service]` as your tree structure and run it at the end of each month. Share the executive summary with finance or leadership instead of building a report from scratch. See the [Monthly Cloud Cost Reporting guide](/automate-reporting/monthly-reviews) for more detail.
### Cost spike investigation
When an alert fires or someone flags a cost increase, open Digest with a narrower time range (e.g., this week vs. last week). The tree will surface which services and accounts drove the increase, and Billy's incident reports will point to the likely root cause.
### Team-level cost accountability
Use [dimensions](/features/tagging/dimensions) in the tree structure to break costs down by team. Each team lead can review their node and understand how their infrastructure spend changed, without needing to build their own queries.
## Frequently Asked Questions
You can configure Digest to run on any recurring schedule. Most teams run it monthly to align with billing cycles, but weekly or custom intervals are supported too.
Yes. The cost breakdown tree is fully configurable. You choose the dimensions (provider, account, service, team, environment) and can apply filters to scope the Digest to what matters to your team.
Yes. Digest pulls from all connected cloud providers. You can break down costs by provider as a top-level dimension or group cross-provider costs by service, team, or any other dimension.
Yes. Every Billy-generated report is editable. You can add annotations, context, or corrections before sharing with your team via Slack, Teams, or email.
[Cost Reports](/features/slack-reports) send a scheduled snapshot of a dashboard, widget, or [Explorer](/features/cost-explorer) context to Slack, Microsoft Teams, or email. Digest is broader: it automatically analyzes your cost structure, ranks changes by impact, and generates AI explanations for each one. Many teams use both, Digest for monthly reviews and Cost Reports for ongoing team-specific visibility.
## Next Steps
Replace manual monthly cost reviews with AI-generated reports
Drill into specific cost changes with full context
Send recurring cost snapshots to your team's channels
Build the dashboards your leadership team wants to see
Give each squad ownership of their cloud costs
Define per-team budgets and automate alerts when teams exceed targets
Because sometimes you just need to laugh about your AWS bill
## Use cases
### Monthly cost reviews
Configure Digest with `[Provider, Account, Service]` as your tree structure and run it at the end of each month. Share the executive summary with finance or leadership instead of building a report from scratch. See the [Monthly Cloud Cost Reporting guide](/automate-reporting/monthly-reviews) for more detail.
### Cost spike investigation
When an alert fires or someone flags a cost increase, open Digest with a narrower time range (e.g., this week vs. last week). The tree will surface which services and accounts drove the increase, and Billy's incident reports will point to the likely root cause.
### Team-level cost accountability
Use [dimensions](/features/tagging/dimensions) in the tree structure to break costs down by team. Each team lead can review their node and understand how their infrastructure spend changed, without needing to build their own queries.
## Frequently Asked Questions
You can configure Digest to run on any recurring schedule. Most teams run it monthly to align with billing cycles, but weekly or custom intervals are supported too.
Yes. The cost breakdown tree is fully configurable. You choose the dimensions (provider, account, service, team, environment) and can apply filters to scope the Digest to what matters to your team.
Yes. Digest pulls from all connected cloud providers. You can break down costs by provider as a top-level dimension or group cross-provider costs by service, team, or any other dimension.
Yes. Every Billy-generated report is editable. You can add annotations, context, or corrections before sharing with your team via Slack, Teams, or email.
[Cost Reports](/features/slack-reports) send a scheduled snapshot of a dashboard, widget, or [Explorer](/features/cost-explorer) context to Slack, Microsoft Teams, or email. Digest is broader: it automatically analyzes your cost structure, ranks changes by impact, and generates AI explanations for each one. Many teams use both, Digest for monthly reviews and Cost Reports for ongoing team-specific visibility.
## Next Steps
Replace manual monthly cost reviews with AI-generated reports
Drill into specific cost changes with full context
Send recurring cost snapshots to your team's channels
Build the dashboards your leadership team wants to see
Give each squad ownership of their cloud costs
Define per-team budgets and automate alerts when teams exceed targets
Because sometimes you just need to laugh about your AWS bill