> ## Documentation Index
> Fetch the complete documentation index at: https://docs.costory.io/llms.txt
> Use this file to discover all available pages before exploring further.
# Events
> Overlay deploy events, Savings Plan purchases, provider changes, and saved business context on Costory cost charts to explain cloud cost changes.
Events add context to cost data. They capture deployments, releases, incidents, provider changes, and business milestones so you can explain why spend changed without switching between billing tools and engineering systems.
 ## Overview
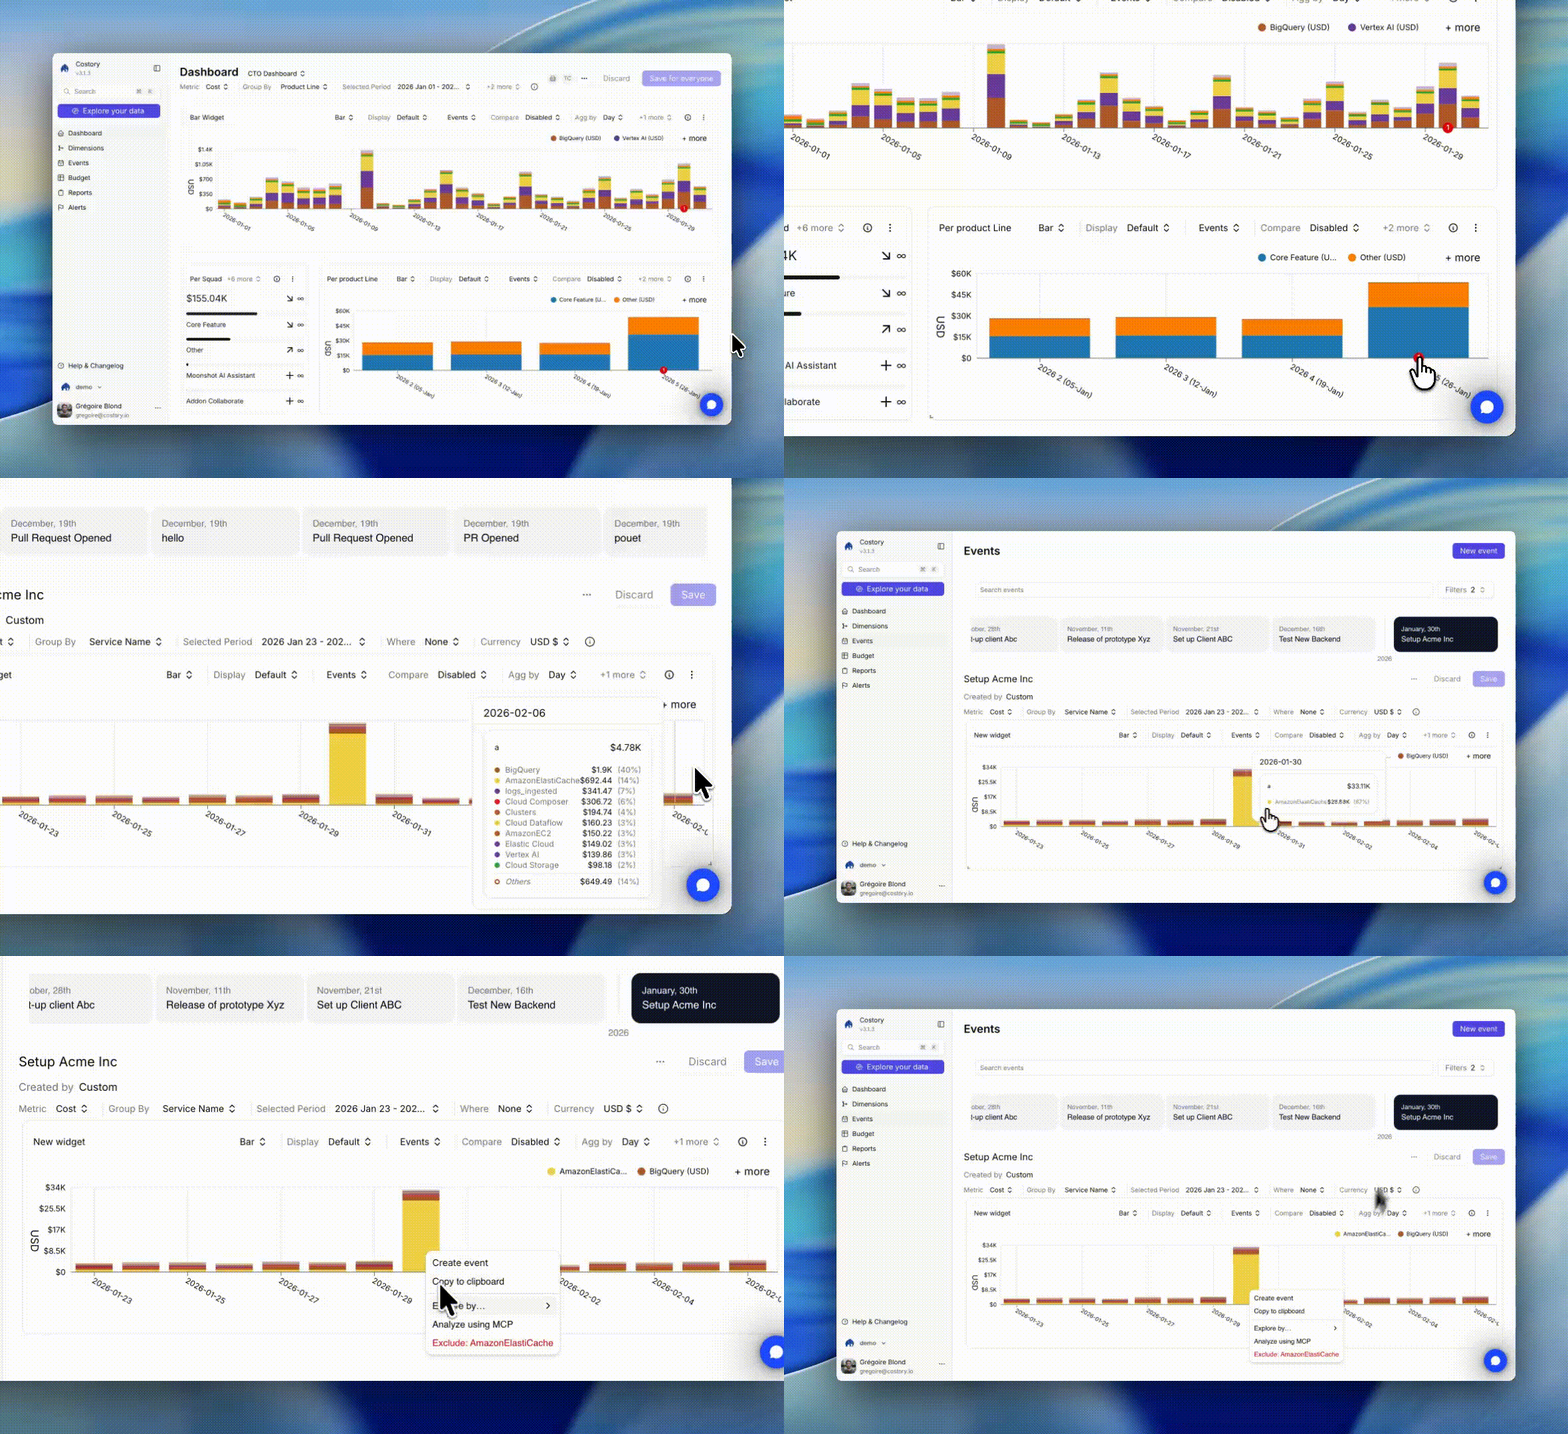
Event correlation overlays events directly on your cost charts. You can compare deploys, purchases, incidents, and custom business events with the spend line in [Explorer](/features/cost-explorer), then save that context to dashboards and reports.
Use events when you need to:
* Save the context behind a cost change
* Correlate deploys, incidents, commitment purchases, and provider changes with spend
* Attach event context to Explorer views, dashboards, and reports
* Give finance and engineering the same timeline for cost discussions
## When to use event correlation
* EC2 spend increases after a deploy marker. Open the event to see which PR was merged and what changed.
* A Savings Plan purchase appears on the chart. Verify whether the cost line drops as expected in the following days.
* A dashboard widget needs context before you share it with another team. Attach the relevant event overlay so the viewer sees the cost movement and the reason together.
* A cost anomaly starts near an outage, migration, campaign, or infrastructure change. Use event markers to rule in or rule out likely causes.
## Overview
Event correlation overlays events directly on your cost charts. You can compare deploys, purchases, incidents, and custom business events with the spend line in [Explorer](/features/cost-explorer), then save that context to dashboards and reports.
Use events when you need to:
* Save the context behind a cost change
* Correlate deploys, incidents, commitment purchases, and provider changes with spend
* Attach event context to Explorer views, dashboards, and reports
* Give finance and engineering the same timeline for cost discussions
## When to use event correlation
* EC2 spend increases after a deploy marker. Open the event to see which PR was merged and what changed.
* A Savings Plan purchase appears on the chart. Verify whether the cost line drops as expected in the following days.
* A dashboard widget needs context before you share it with another team. Attach the relevant event overlay so the viewer sees the cost movement and the reason together.
* A cost anomaly starts near an outage, migration, campaign, or infrastructure change. Use event markers to rule in or rule out likely causes.
 ## Use events in Explorer
Navigate to [Explorer](/features/cost-explorer) and build the cost query you want to explain.
Click **Show Events** in the toolbar. The Events panel opens with available events grouped by category. Toggle categories on or off, or add individual events to the chart.
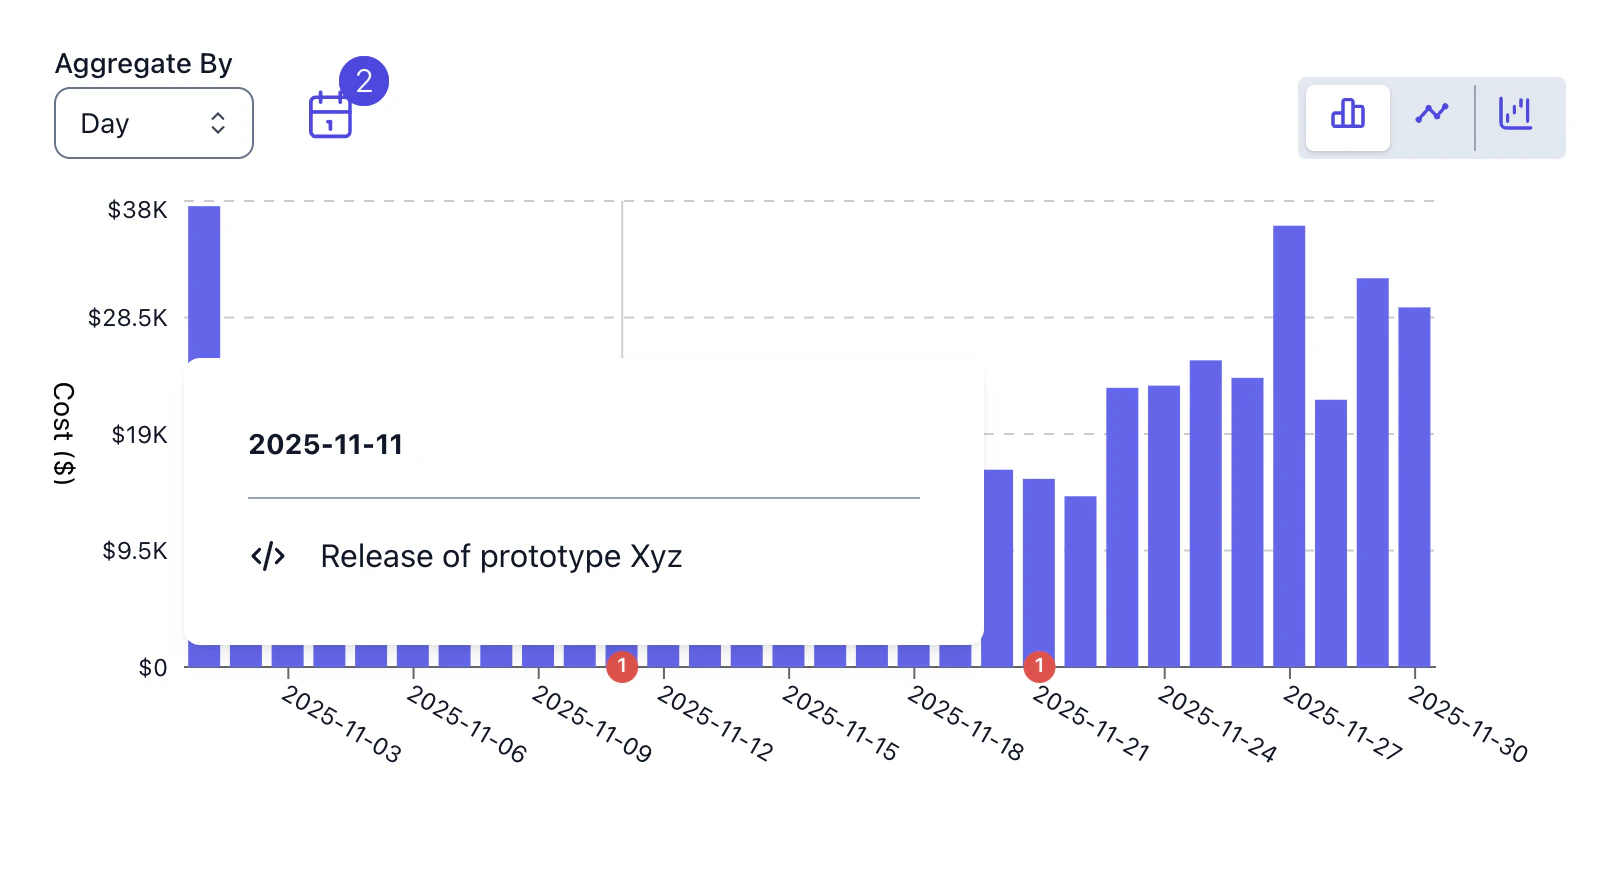
Event markers appear as numbered badges on the chart timeline. Hover over a marker to see the event type, timestamp, and description.
## Use events in Explorer
Navigate to [Explorer](/features/cost-explorer) and build the cost query you want to explain.
Click **Show Events** in the toolbar. The Events panel opens with available events grouped by category. Toggle categories on or off, or add individual events to the chart.
Event markers appear as numbered badges on the chart timeline. Hover over a marker to see the event type, timestamp, and description.
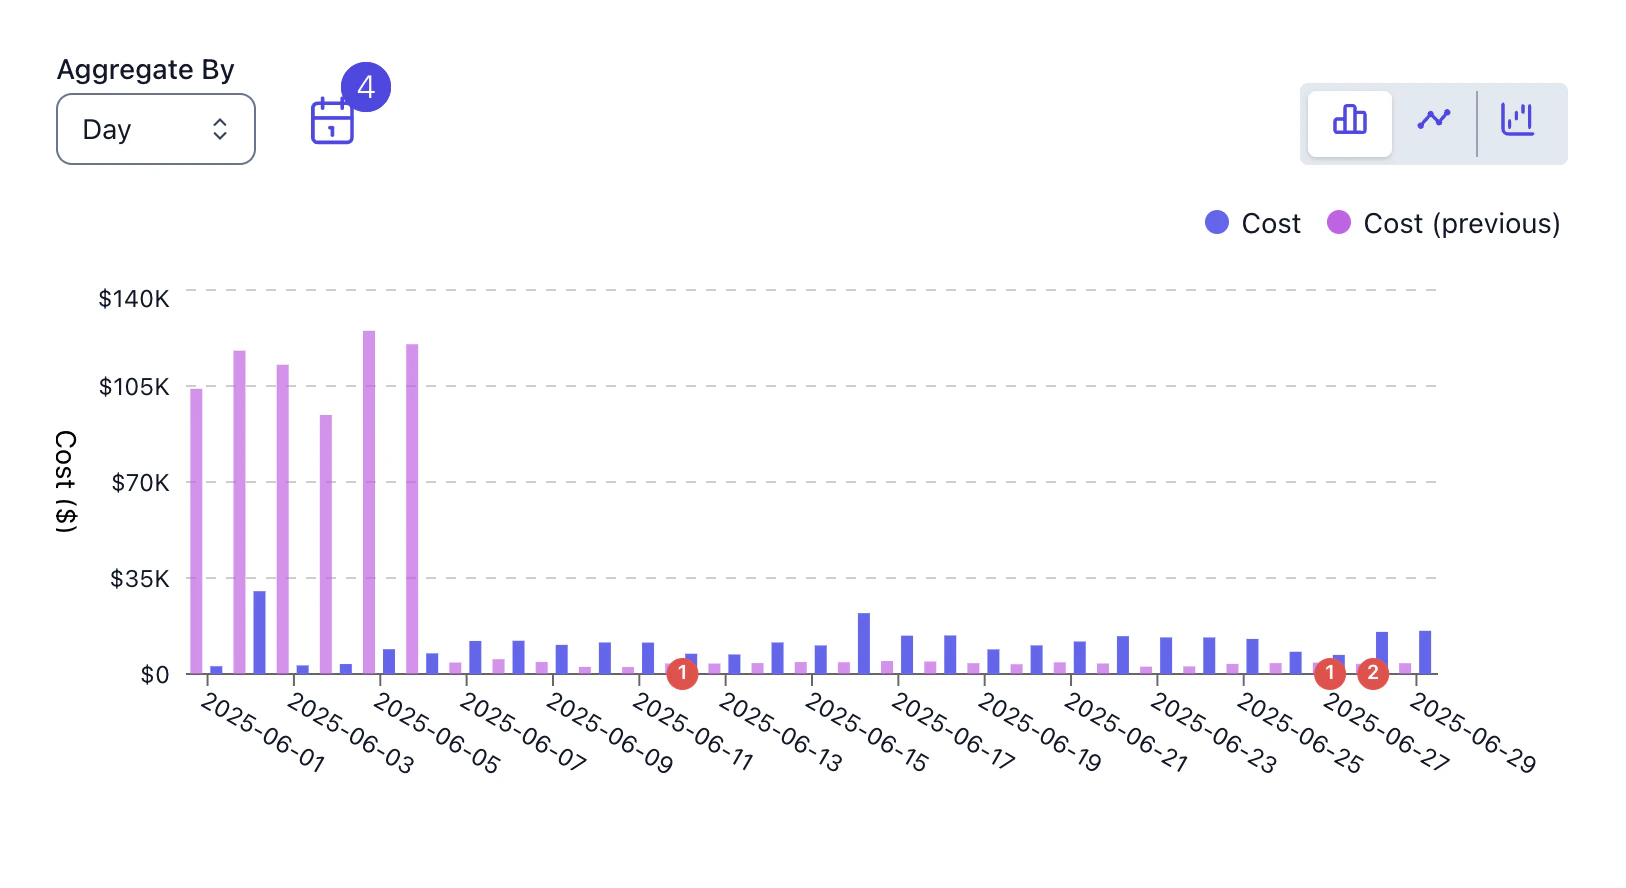 Save the Explorer view, add it to a [dashboard](/features/dashboards), or schedule it as a [Cost Report](/features/slack-reports) so the event context stays attached.
Pair events with [waterfall charts](/features/dashboards/widgets#waterfall-charts). The waterfall shows which services or teams moved. Events help explain what changed around the same date.
## Example: investigate a cost spike after a deploy
Your weekly EC2 bill increases by 30% starting March 5. Event correlation helps you move from cost movement to likely cause:
1. Open Explorer and filter to EC2 costs for the past two weeks.
2. Enable GitHub events. A deploy marker appears on March 5, the same day the spike starts.
3. Open the event details. PR #1234 was merged with the description "Add nightly batch processing job for ML model retraining."
4. Use the event context to decide whether to optimize instance types, adjust scheduling, or accept the added cost.
Without events, the same investigation usually requires checking deployment logs, Slack threads, CI/CD history, and billing data separately.
## Attach events to dashboards and reports
You can attach event overlays to dashboard widgets so the context travels with the data. When a colleague opens the dashboard or receives it as a Cost Report, they see both the cost data and the events that explain it.
Save the Explorer view, add it to a [dashboard](/features/dashboards), or schedule it as a [Cost Report](/features/slack-reports) so the event context stays attached.
Pair events with [waterfall charts](/features/dashboards/widgets#waterfall-charts). The waterfall shows which services or teams moved. Events help explain what changed around the same date.
## Example: investigate a cost spike after a deploy
Your weekly EC2 bill increases by 30% starting March 5. Event correlation helps you move from cost movement to likely cause:
1. Open Explorer and filter to EC2 costs for the past two weeks.
2. Enable GitHub events. A deploy marker appears on March 5, the same day the spike starts.
3. Open the event details. PR #1234 was merged with the description "Add nightly batch processing job for ML model retraining."
4. Use the event context to decide whether to optimize instance types, adjust scheduling, or accept the added cost.
Without events, the same investigation usually requires checking deployment logs, Slack threads, CI/CD history, and billing data separately.
## Attach events to dashboards and reports
You can attach event overlays to dashboard widgets so the context travels with the data. When a colleague opens the dashboard or receives it as a Cost Report, they see both the cost data and the events that explain it.
 For automated cost change detection, the [Digest](/features/digest) surfaces high-impact changes and generates AI summaries you can share.
## Find and manage saved events
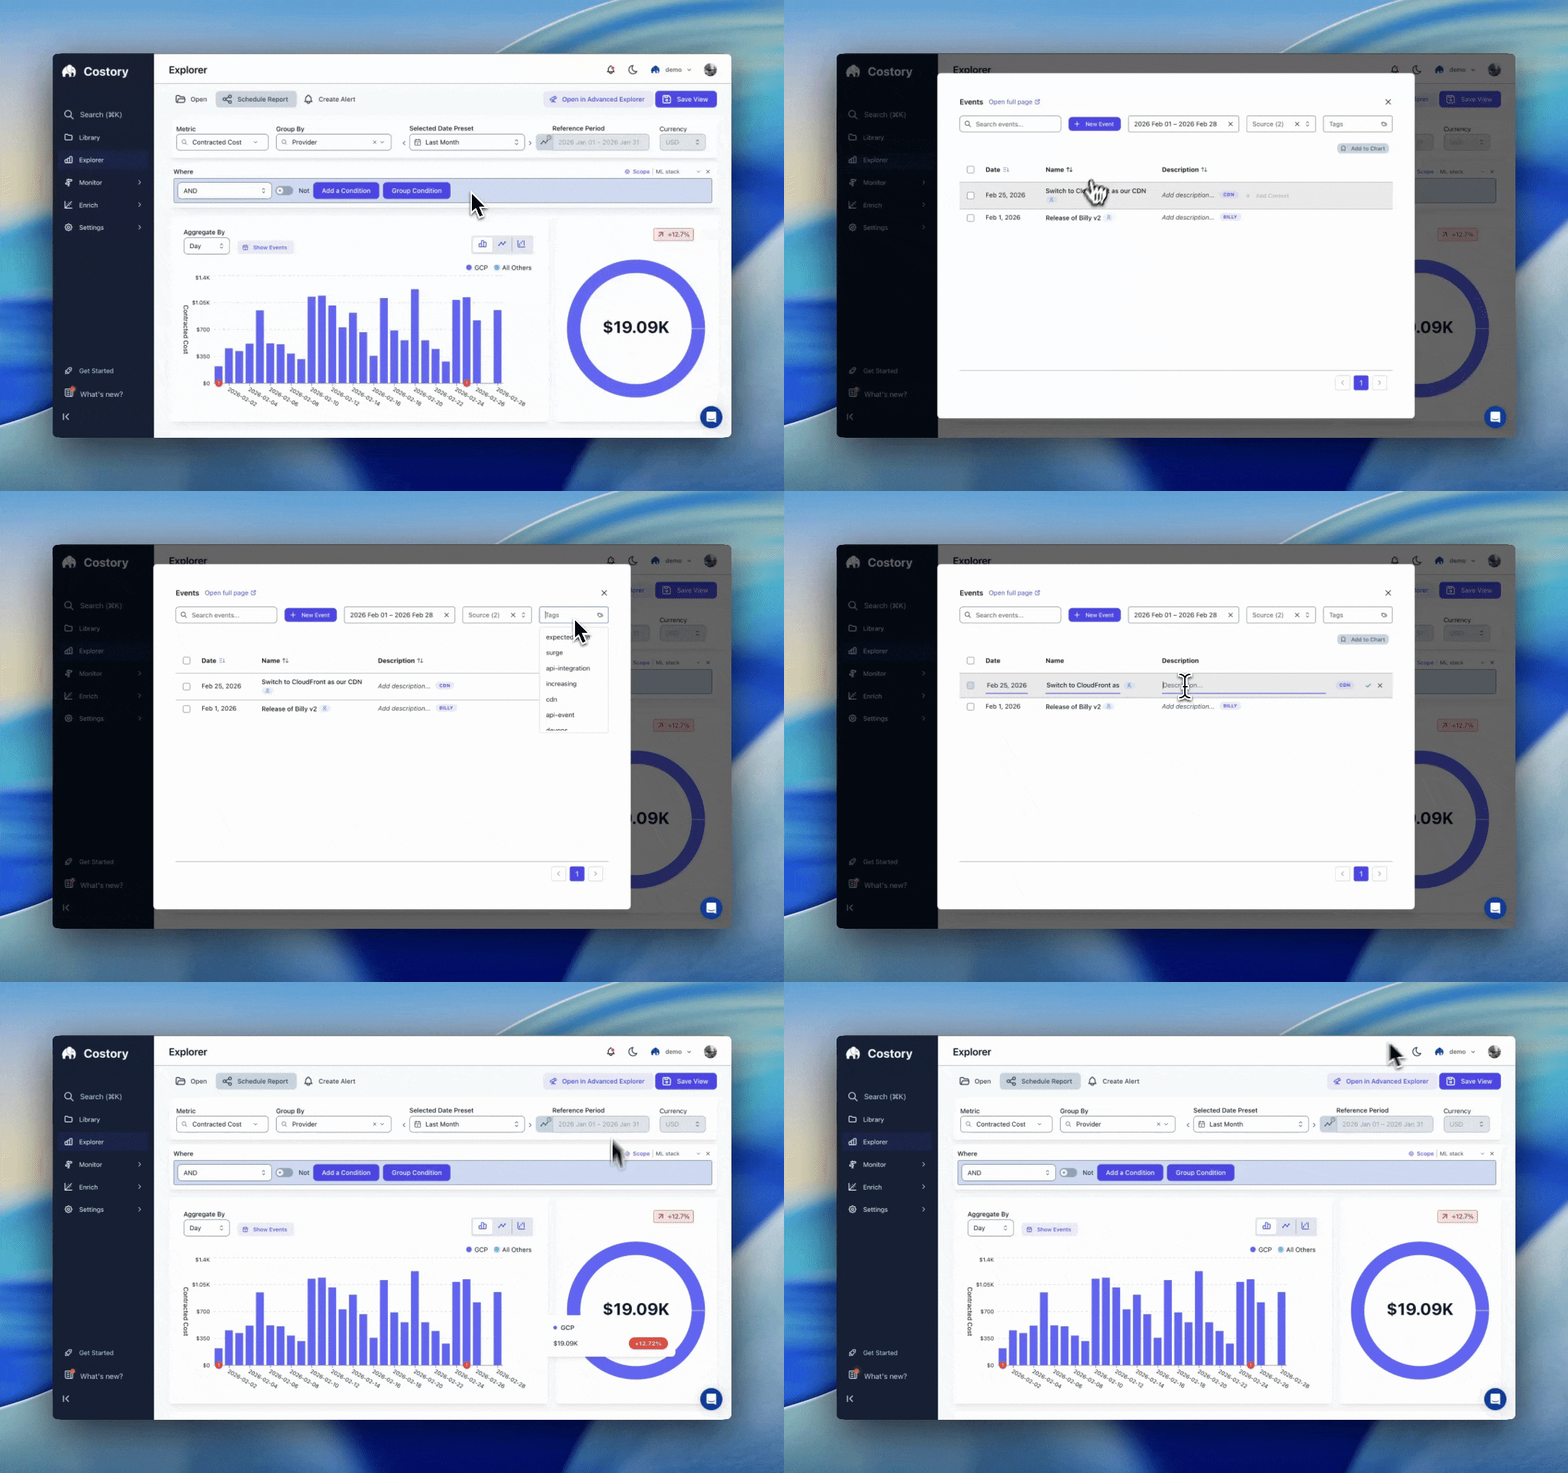
The Events page is where you search, filter, create, and reopen events across your organization. Each saved event can include the date, source, category, labels, description, and linked cost analysis.
For automated cost change detection, the [Digest](/features/digest) surfaces high-impact changes and generates AI summaries you can share.
## Find and manage saved events
The Events page is where you search, filter, create, and reopen events across your organization. Each saved event can include the date, source, category, labels, description, and linked cost analysis.
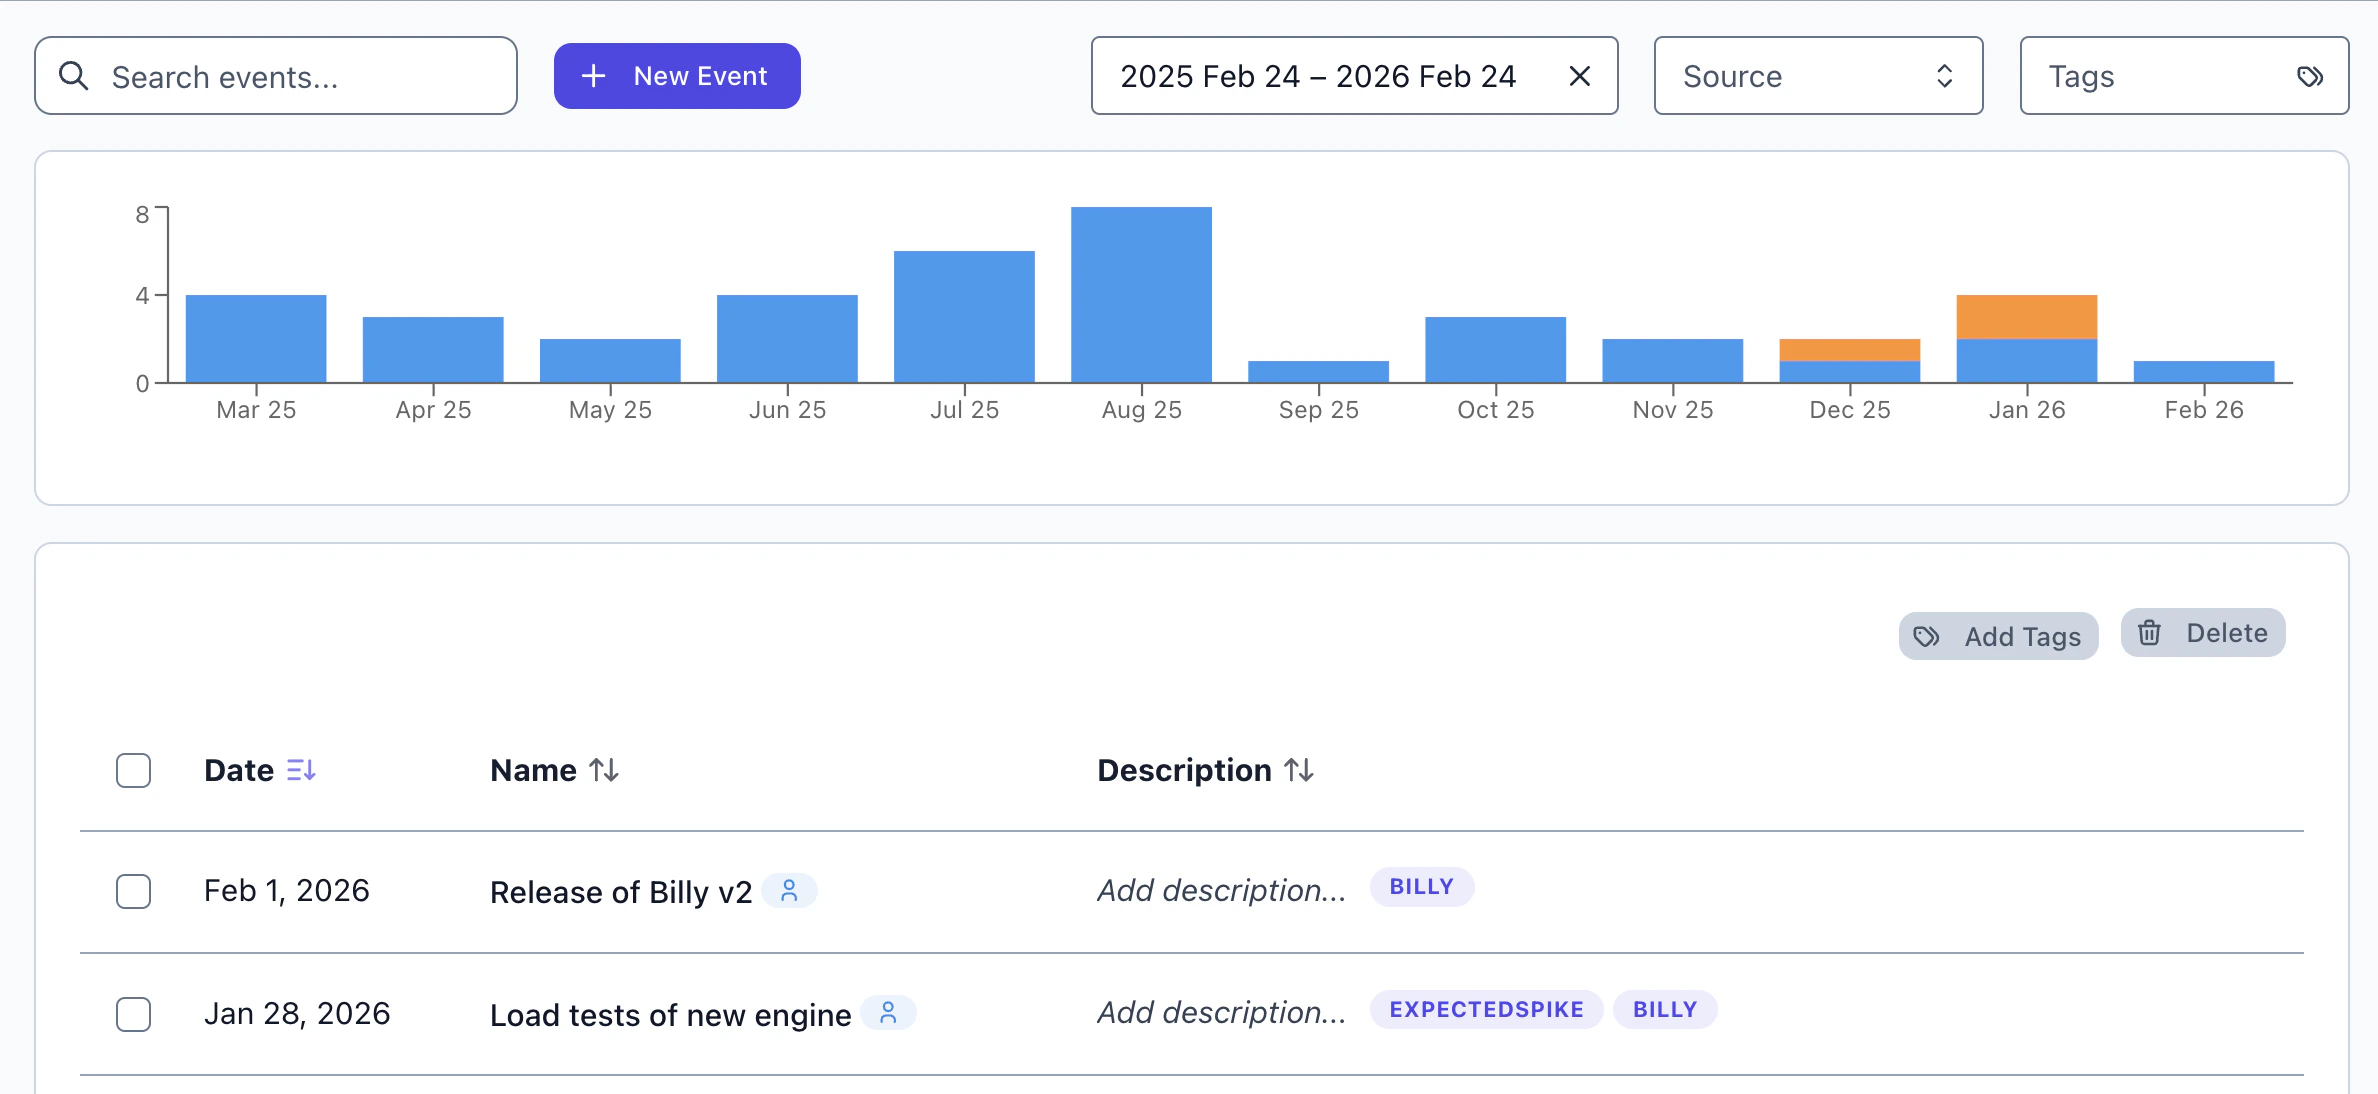 From the Events page, you can:
* Search by title, source, category, label, or date range
* Open an event to review its description and linked context
* Add an event to an Explorer chart
* Edit manually created events when the context changes
## Create a saved event with context
You can log an event from chat. Tell the [Costory MCP](/features/mcp) *"add a deploy event for the payments service today"* and it creates the annotation so it shows up on your cost charts.
Navigate to **Events** from the left sidebar.
Click **New event** and enter the date, title, category, source, and description.
Add labels or scope details that help people understand where the event applies, such as `environment = production`, a cloud provider, a team, or a service.
Save the event so it appears on the Events page and can be added to Explorer charts.
## Set up event sources
To overlay events in Explorer, connect at least one event source:
Import deploys and PR merges.
Send pipeline and deployment events.
Push business or technical events.
Cloud provider events, including Savings Plan purchases and CUD activations, are detected from billing data. No additional setup is required after billing data is connected.
Pushing a custom event is a single `POST /v1/events` call with a JSON body. Add it to your CI/CD pipeline and see the [Custom API guide](/setup/events/custom-api) for the full spec.
## Frequently Asked Questions
No. Events are metadata. They explain cost changes but do not modify billing rows, allocation rules, or cost metrics.
Yes. Create an event with a historical timestamp, or post one through the Events API. Costory places it on the correct date in Explorer.
Yes. When events are attached to a saved Explorer view or dashboard, the context can appear in scheduled reports that use that view.
Yes. Add events to a chart that uses a [unit economics](/features/unit-economics) formula, such as cost per DAU or cost per transaction. This helps you see whether a deploy increased total spend while efficiency stayed on target.
## Related links
Connect GitHub, CI/CD, provider, and API event sources.
Investigate cost changes with event context.
Add formulas such as cost per user or cost per transaction.
Walk through cost change investigations with events.
From the Events page, you can:
* Search by title, source, category, label, or date range
* Open an event to review its description and linked context
* Add an event to an Explorer chart
* Edit manually created events when the context changes
## Create a saved event with context
You can log an event from chat. Tell the [Costory MCP](/features/mcp) *"add a deploy event for the payments service today"* and it creates the annotation so it shows up on your cost charts.
Navigate to **Events** from the left sidebar.
Click **New event** and enter the date, title, category, source, and description.
Add labels or scope details that help people understand where the event applies, such as `environment = production`, a cloud provider, a team, or a service.
Save the event so it appears on the Events page and can be added to Explorer charts.
## Set up event sources
To overlay events in Explorer, connect at least one event source:
Import deploys and PR merges.
Send pipeline and deployment events.
Push business or technical events.
Cloud provider events, including Savings Plan purchases and CUD activations, are detected from billing data. No additional setup is required after billing data is connected.
Pushing a custom event is a single `POST /v1/events` call with a JSON body. Add it to your CI/CD pipeline and see the [Custom API guide](/setup/events/custom-api) for the full spec.
## Frequently Asked Questions
No. Events are metadata. They explain cost changes but do not modify billing rows, allocation rules, or cost metrics.
Yes. Create an event with a historical timestamp, or post one through the Events API. Costory places it on the correct date in Explorer.
Yes. When events are attached to a saved Explorer view or dashboard, the context can appear in scheduled reports that use that view.
Yes. Add events to a chart that uses a [unit economics](/features/unit-economics) formula, such as cost per DAU or cost per transaction. This helps you see whether a deploy increased total spend while efficiency stayed on target.
## Related links
Connect GitHub, CI/CD, provider, and API event sources.
Investigate cost changes with event context.
Add formulas such as cost per user or cost per transaction.
Walk through cost change investigations with events.