> ## Documentation Index
> Fetch the complete documentation index at: https://docs.costory.io/llms.txt
> Use this file to discover all available pages before exploring further.
# Cost Reports
> Schedule recurring cloud cost reports to Slack, Microsoft Teams, or email from dashboards, widgets, or Explorer context.
Cost dashboards only work if people see them. **Cost Reports** deliver multi-cloud cost breakdowns directly to Slack, Microsoft Teams, or email on a recurring schedule.
 ## Overview
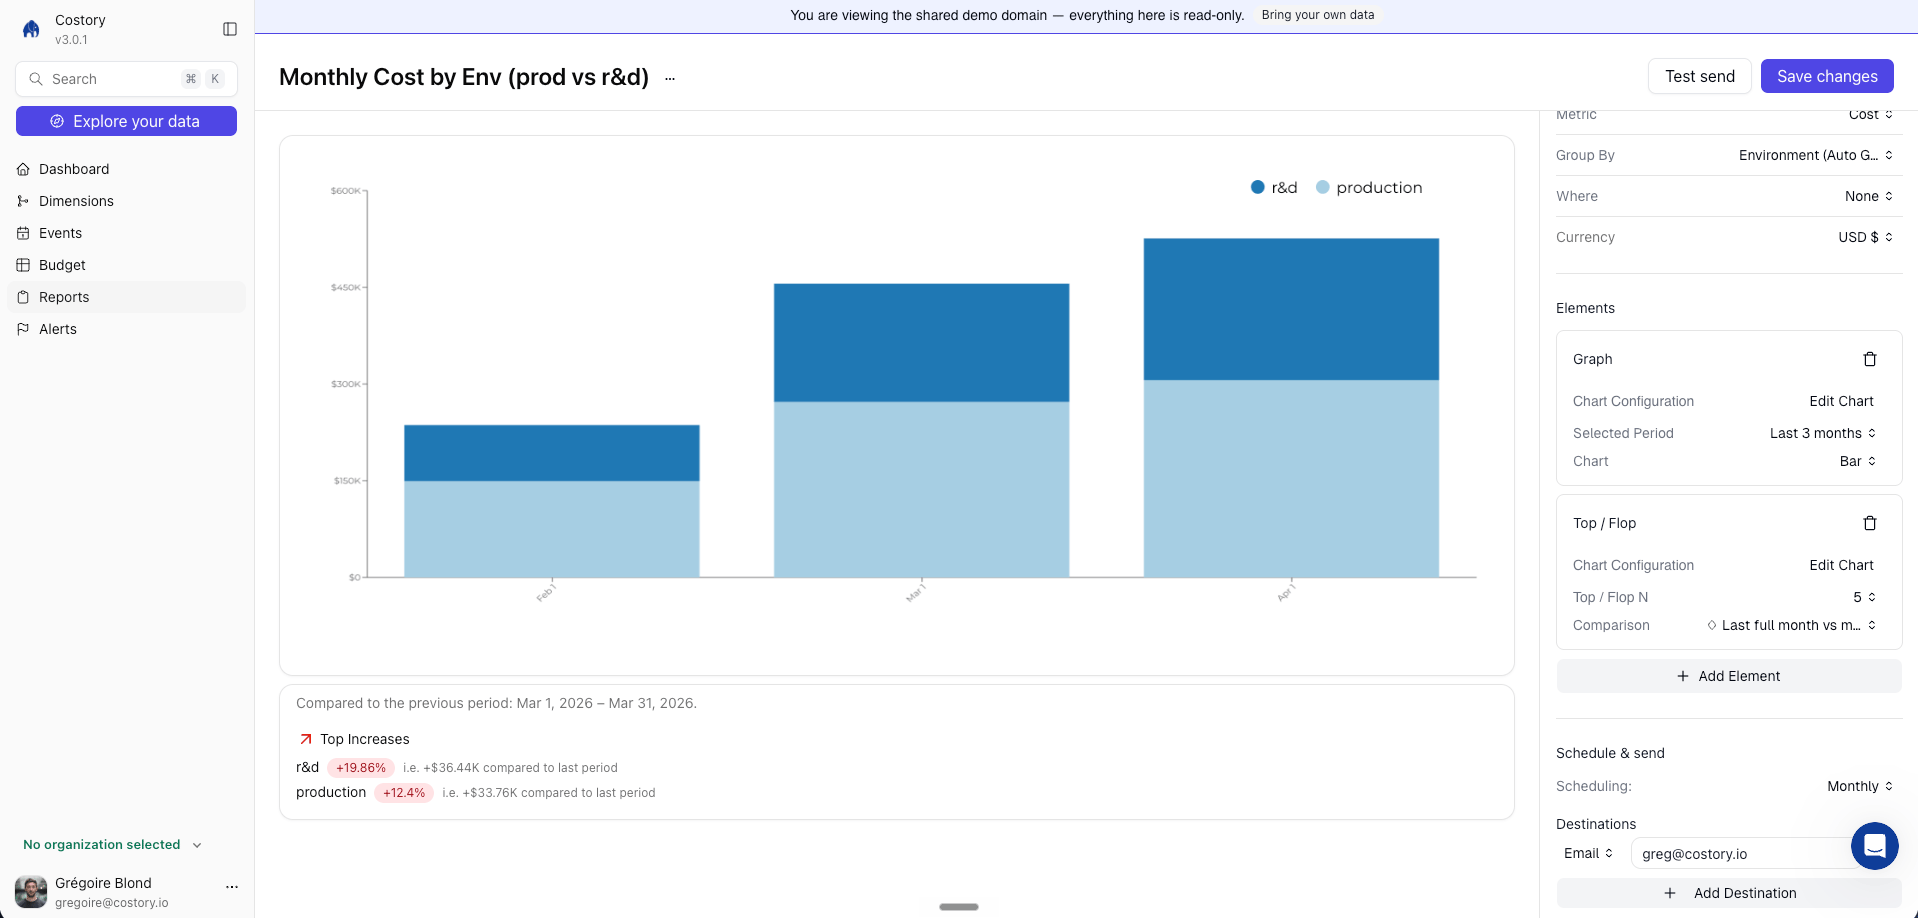
Cost Reports deliver a dashboard, dashboard widget, or Explorer-backed cost view as a formatted snapshot on a schedule you define. Each report includes the cost breakdown, a comparison against a previous period, and a direct link back to Costory.
Where it fits in your day-to-day:
* Sending weekly cost updates to each squad's Slack channel so engineers see their infrastructure spend without logging into a dashboard
* Delivering monthly executive summaries to leadership with pre-filtered views scoped to their business unit
* Keeping SRE and platform teams informed about infrastructure cost trends as part of their existing review cadence
## Get started
Open the [dashboard](/features/dashboards), dashboard widget, or [Explorer](/features/cost-explorer) query you want to deliver on a schedule.
Open the action menu and select **Schedule Report**. This opens the scheduling
configuration panel.
## Overview
Cost Reports deliver a dashboard, dashboard widget, or Explorer-backed cost view as a formatted snapshot on a schedule you define. Each report includes the cost breakdown, a comparison against a previous period, and a direct link back to Costory.
Where it fits in your day-to-day:
* Sending weekly cost updates to each squad's Slack channel so engineers see their infrastructure spend without logging into a dashboard
* Delivering monthly executive summaries to leadership with pre-filtered views scoped to their business unit
* Keeping SRE and platform teams informed about infrastructure cost trends as part of their existing review cadence
## Get started
Open the [dashboard](/features/dashboards), dashboard widget, or [Explorer](/features/cost-explorer) query you want to deliver on a schedule.
Open the action menu and select **Schedule Report**. This opens the scheduling
configuration panel.
 Select where the report should be delivered. Costory supports Slack,
Microsoft Teams, and email.
You can create multiple scheduled reports from the same source view, each
targeting a different channel or cadence.
Before first delivery, complete channel setup for
[Slack](/setup/collaboration/slack), [Microsoft
Teams](/setup/collaboration/teams), or
[Email](/setup/collaboration/email).
Set the delivery schedule and the comparison period for the report.
How often the report is generated and delivered.
The reference period shown alongside the current period, so recipients see
the cost change at a glance.
Review the configuration and click **Save**. You can send a test report
immediately to verify the channel, format, and data before the first
scheduled delivery.
There is no additional cost for scheduling reports. Send as many as you need
across Slack, Teams, and email.
## Use cases
### Squad cost updates
Send weekly reports to each engineering squad's Slack channel with a dashboard or widget scoped to their services, accounts, or [dimensions](/features/tagging/dimensions). Engineers see their cost impact as part of their regular workflow, which builds cost awareness without requiring anyone to open a dashboard. See the [Decentralize FinOps guide](/automate-reporting/decentralize-finops) for a full walkthrough.
### SRE and platform reviews
Platform teams can subscribe to a cost view grouped by infrastructure service (compute, networking, storage) and receive a weekly or monthly report. This surfaces cost trends alongside their existing reliability and capacity review cadence.
### Leadership briefings
Create a high-level dashboard grouped by business unit or provider and deliver it monthly to a leadership channel or mailing list. The comparison period gives executives a one-glance summary of how cloud spend changed, without needing to learn the Explorer interface. See [Executive Cost Reports](/use-cases/what_your_exec_team_wants/value) for more on building views for stakeholders.
## Frequently Asked Questions
Costory supports Slack, Microsoft Teams, and email. You can send the same
report to multiple channels by creating separate schedules from the same
source view.
Yes. Each scheduled report is tied to a specific dashboard, widget, or Explorer context. You can create as
many source views as you need and schedule each one to a different channel with its own cadence.
Reports can be sent weekly or monthly. The cadence is configured per
schedule, so one source view can have a weekly report going to the engineering
channel and a monthly report going to leadership.
Cost Reports deliver a snapshot of a dashboard, widget, or [Explorer](/features/cost-explorer) context on a recurring schedule.
[Digest](/features/digest) is broader: it automatically analyzes your entire
cost structure, ranks changes by dollar impact, and generates AI
explanations for each change. Many teams use both, Cost Reports for ongoing
team-level visibility and Digest for monthly cost reviews and anomaly
triage.
No. Scheduled reports are included at no additional cost, and there is no
cap on the number of active schedules.
## Next Steps
Build persistent cost dashboards with multiple widgets
Build the query context behind a report
Auto-triage cost anomalies with AI-generated incident reports
Give each squad ownership of their cloud costs
Define per-team budgets and automate alerts when teams exceed targets
Build the dashboards your leadership team wants to see
Automate your monthly cloud cost reporting workflow
Select where the report should be delivered. Costory supports Slack,
Microsoft Teams, and email.
You can create multiple scheduled reports from the same source view, each
targeting a different channel or cadence.
Before first delivery, complete channel setup for
[Slack](/setup/collaboration/slack), [Microsoft
Teams](/setup/collaboration/teams), or
[Email](/setup/collaboration/email).
Set the delivery schedule and the comparison period for the report.
How often the report is generated and delivered.
The reference period shown alongside the current period, so recipients see
the cost change at a glance.
Review the configuration and click **Save**. You can send a test report
immediately to verify the channel, format, and data before the first
scheduled delivery.
There is no additional cost for scheduling reports. Send as many as you need
across Slack, Teams, and email.
## Use cases
### Squad cost updates
Send weekly reports to each engineering squad's Slack channel with a dashboard or widget scoped to their services, accounts, or [dimensions](/features/tagging/dimensions). Engineers see their cost impact as part of their regular workflow, which builds cost awareness without requiring anyone to open a dashboard. See the [Decentralize FinOps guide](/automate-reporting/decentralize-finops) for a full walkthrough.
### SRE and platform reviews
Platform teams can subscribe to a cost view grouped by infrastructure service (compute, networking, storage) and receive a weekly or monthly report. This surfaces cost trends alongside their existing reliability and capacity review cadence.
### Leadership briefings
Create a high-level dashboard grouped by business unit or provider and deliver it monthly to a leadership channel or mailing list. The comparison period gives executives a one-glance summary of how cloud spend changed, without needing to learn the Explorer interface. See [Executive Cost Reports](/use-cases/what_your_exec_team_wants/value) for more on building views for stakeholders.
## Frequently Asked Questions
Costory supports Slack, Microsoft Teams, and email. You can send the same
report to multiple channels by creating separate schedules from the same
source view.
Yes. Each scheduled report is tied to a specific dashboard, widget, or Explorer context. You can create as
many source views as you need and schedule each one to a different channel with its own cadence.
Reports can be sent weekly or monthly. The cadence is configured per
schedule, so one source view can have a weekly report going to the engineering
channel and a monthly report going to leadership.
Cost Reports deliver a snapshot of a dashboard, widget, or [Explorer](/features/cost-explorer) context on a recurring schedule.
[Digest](/features/digest) is broader: it automatically analyzes your entire
cost structure, ranks changes by dollar impact, and generates AI
explanations for each change. Many teams use both, Cost Reports for ongoing
team-level visibility and Digest for monthly cost reviews and anomaly
triage.
No. Scheduled reports are included at no additional cost, and there is no
cap on the number of active schedules.
## Next Steps
Build persistent cost dashboards with multiple widgets
Build the query context behind a report
Auto-triage cost anomalies with AI-generated incident reports
Give each squad ownership of their cloud costs
Define per-team budgets and automate alerts when teams exceed targets
Build the dashboards your leadership team wants to see
Automate your monthly cloud cost reporting workflow