> ## Documentation Index
> Fetch the complete documentation index at: https://docs.costory.io/llms.txt
> Use this file to discover all available pages before exploring further.
# Unit Economics
> Build cloud unit economics in Costory Explorer by combining cloud cost metrics, usage metrics, and formulas such as cost per user, cost per API call, or ROI.
Unit economics turns cloud spend into efficiency metrics. Use it when total cost is rising and you need to know whether cost per user, transaction, request, or workload is improving.
 ## Overview
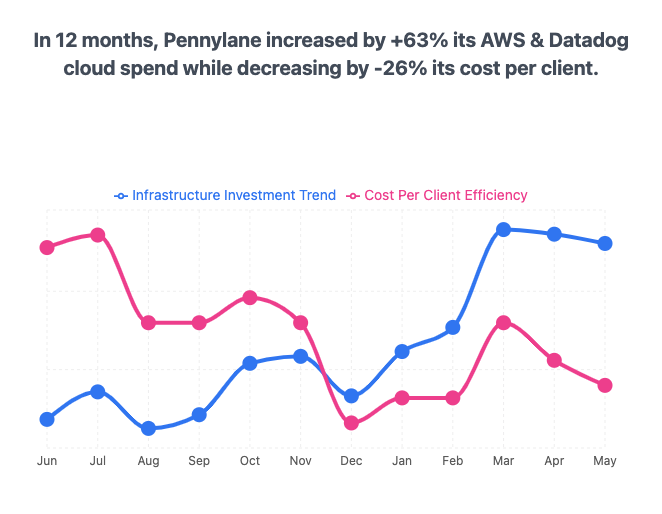
Costory Explorer lets you combine cost metrics, usage metrics, and formulas in the same chart. Instead of stopping at "compute spend increased", you can track "cost per active user decreased" or "cost per transaction crossed our target".
Use unit economics when you need to:
* Explain cloud cost increases in the context of business growth
* Track cost per customer, API call, transaction, build minute, or container-hour
* Compare efficiency by team, service, region, or product
* Report engineering improvements in the same terms finance and leadership use
## What you can build
* Track infrastructure ratios such as cost per GB transferred, build minute, or container-hour by dividing cloud spend by usage metrics from your billing data or Datadog.
* Track application ratios such as cost per API call, daily active user, or transaction by connecting external metrics from Amplitude, BigQuery, CSV, or Google Sheets.
* Compare the cost of a new service against the service it replaced by grouping formulas by service tag.
* Track realized savings from Savings Plans or CUDs by computing `list_cost - total_cost`.
* Build custom KPIs for commitment utilization, coverage, and ROI.
You can apply these patterns to [hourly granularity for bursty workloads](/use-cases/hourly-cost-granularity), [BigQuery cost visibility with dbt](/use-cases/dbt_bigquery_visibility/increase_visibility), or [allocating shared database costs](/use-cases/allocate_shared_cloud_sql_database/allocate).
## Metric types
Costory's query bar supports the metric types you need for formulas.
Built-in billing metrics from your connected cloud providers. These include total cost, Contracted Cost, list cost, and usage quantity.
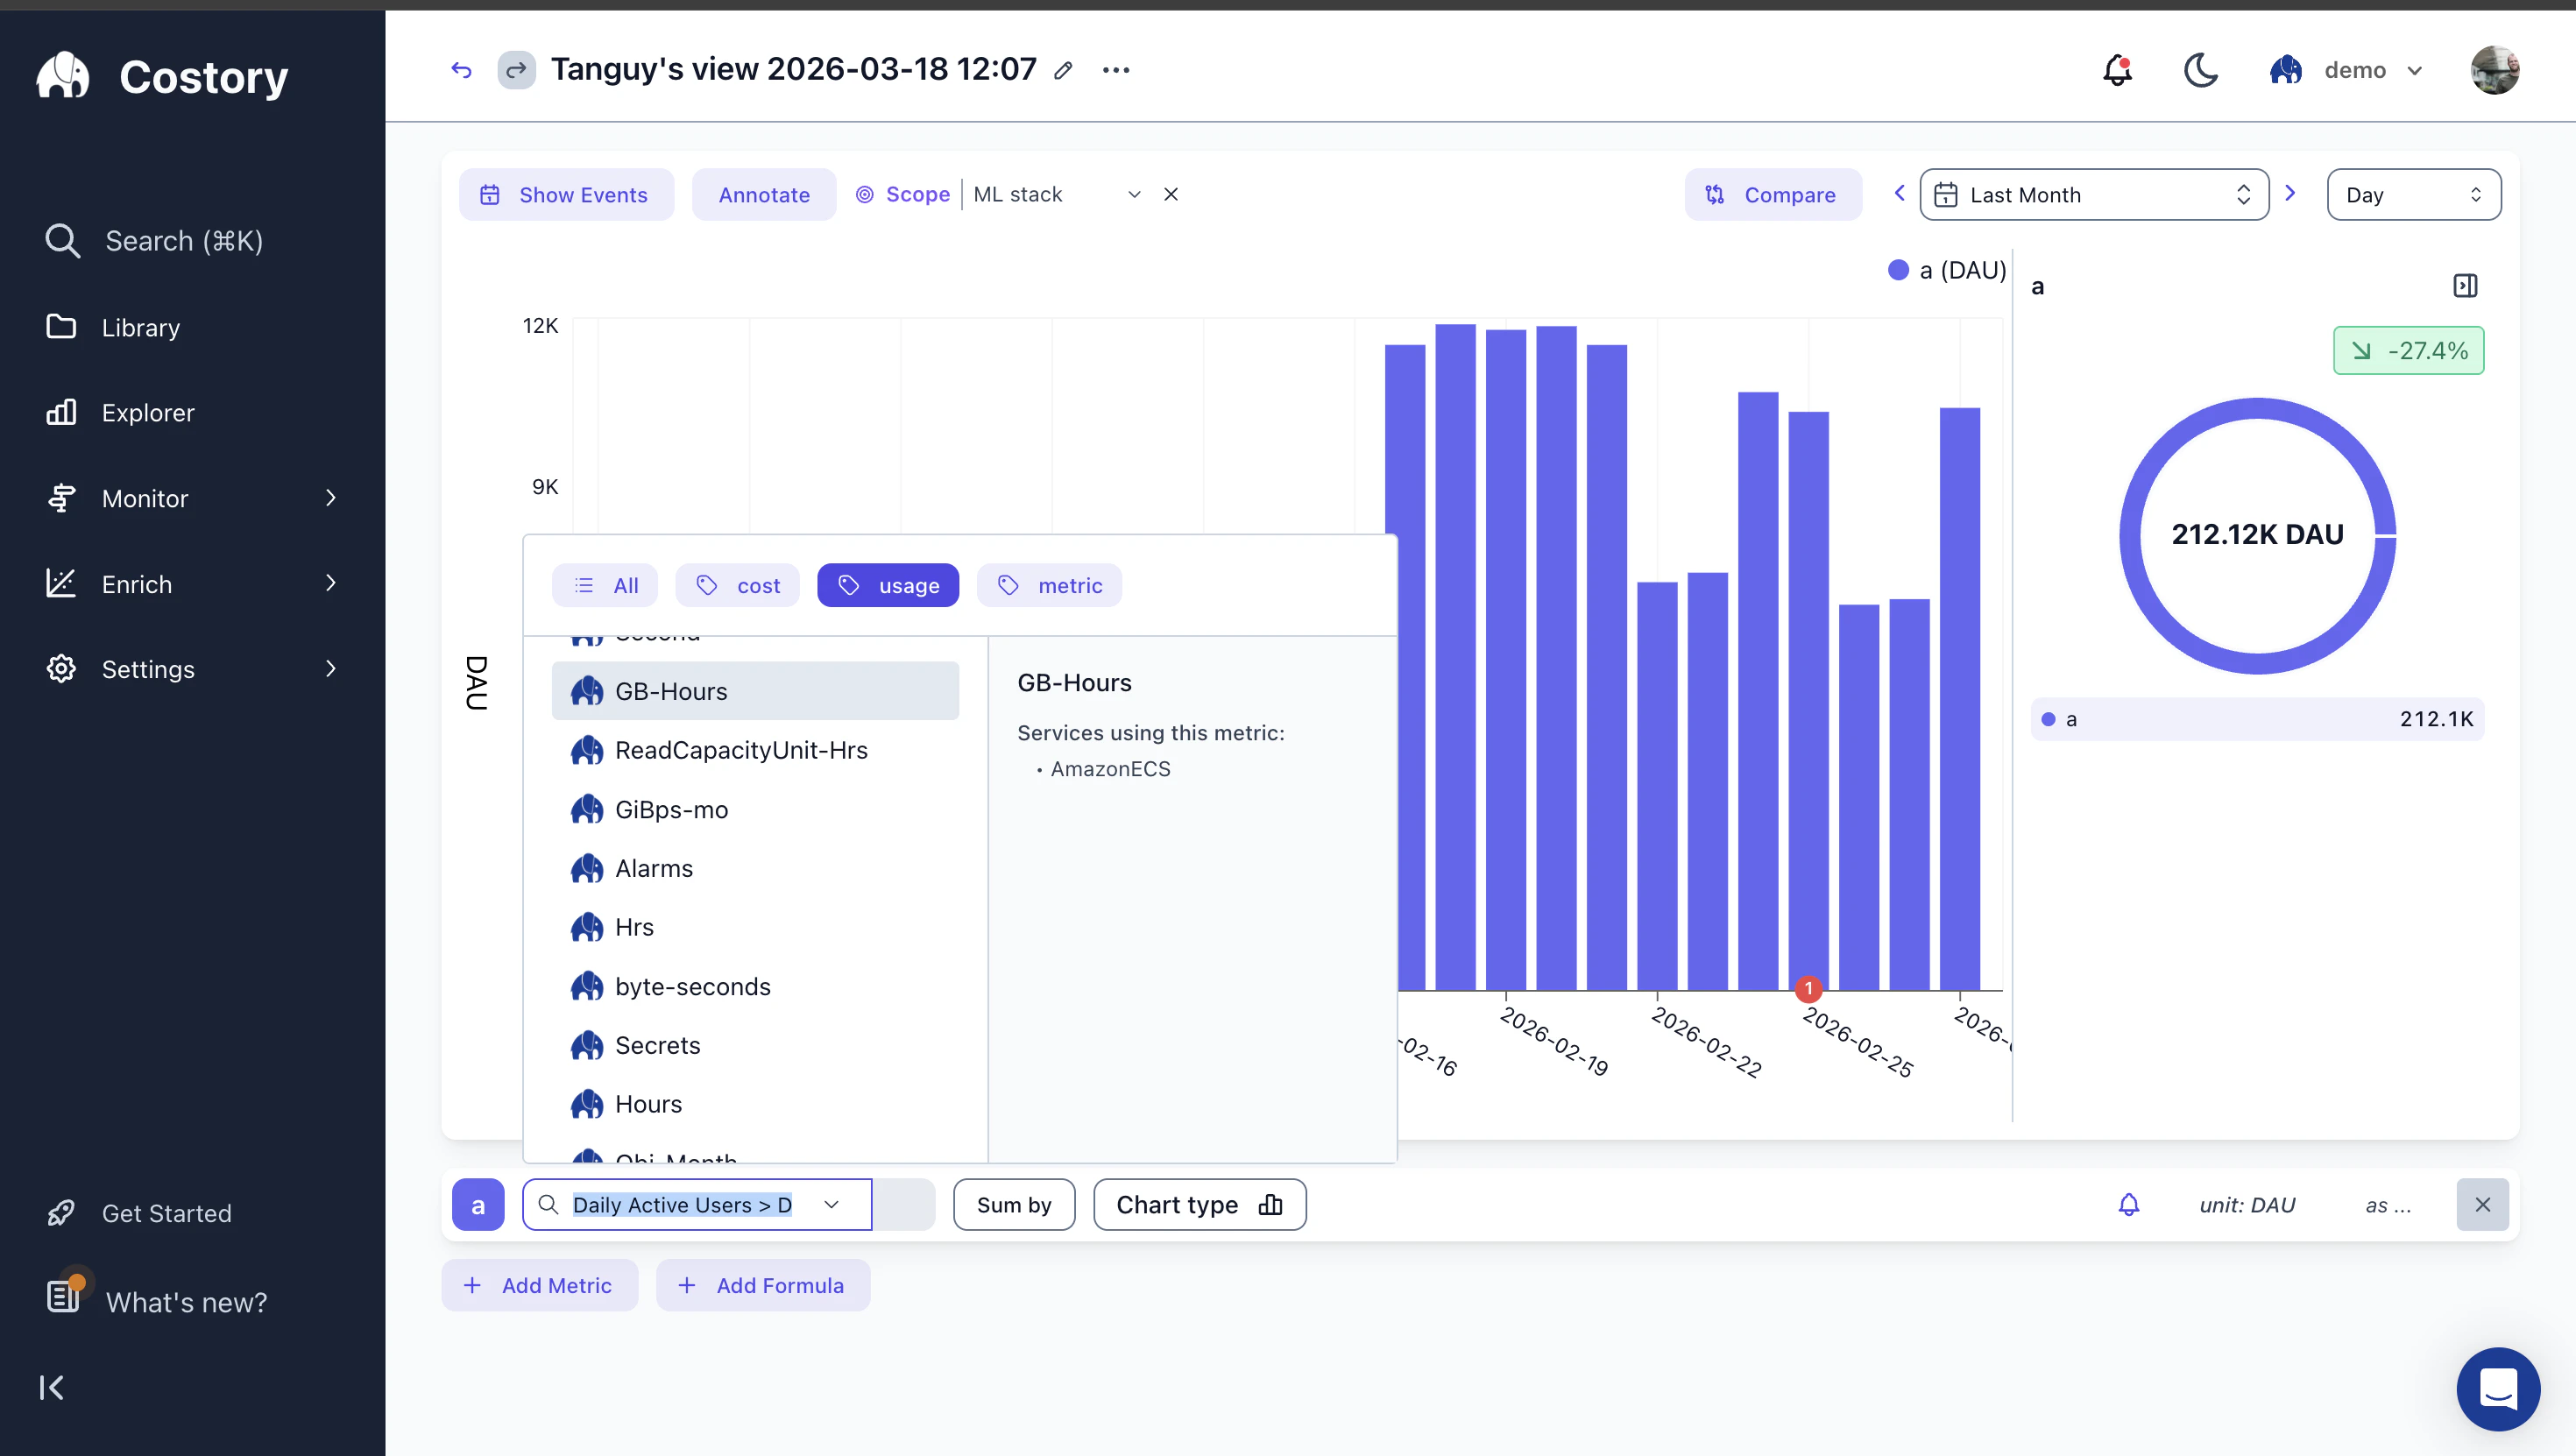
Cloud provider usage metrics such as GB-Hours, ReadCapacityUnit-Hrs, and vCPU-Hours. These come from your billing data and describe how much of a resource you consumed.
## Overview
Costory Explorer lets you combine cost metrics, usage metrics, and formulas in the same chart. Instead of stopping at "compute spend increased", you can track "cost per active user decreased" or "cost per transaction crossed our target".
Use unit economics when you need to:
* Explain cloud cost increases in the context of business growth
* Track cost per customer, API call, transaction, build minute, or container-hour
* Compare efficiency by team, service, region, or product
* Report engineering improvements in the same terms finance and leadership use
## What you can build
* Track infrastructure ratios such as cost per GB transferred, build minute, or container-hour by dividing cloud spend by usage metrics from your billing data or Datadog.
* Track application ratios such as cost per API call, daily active user, or transaction by connecting external metrics from Amplitude, BigQuery, CSV, or Google Sheets.
* Compare the cost of a new service against the service it replaced by grouping formulas by service tag.
* Track realized savings from Savings Plans or CUDs by computing `list_cost - total_cost`.
* Build custom KPIs for commitment utilization, coverage, and ROI.
You can apply these patterns to [hourly granularity for bursty workloads](/use-cases/hourly-cost-granularity), [BigQuery cost visibility with dbt](/use-cases/dbt_bigquery_visibility/increase_visibility), or [allocating shared database costs](/use-cases/allocate_shared_cloud_sql_database/allocate).
## Metric types
Costory's query bar supports the metric types you need for formulas.
Built-in billing metrics from your connected cloud providers. These include total cost, Contracted Cost, list cost, and usage quantity.
Cloud provider usage metrics such as GB-Hours, ReadCapacityUnit-Hrs, and vCPU-Hours. These come from your billing data and describe how much of a resource you consumed.
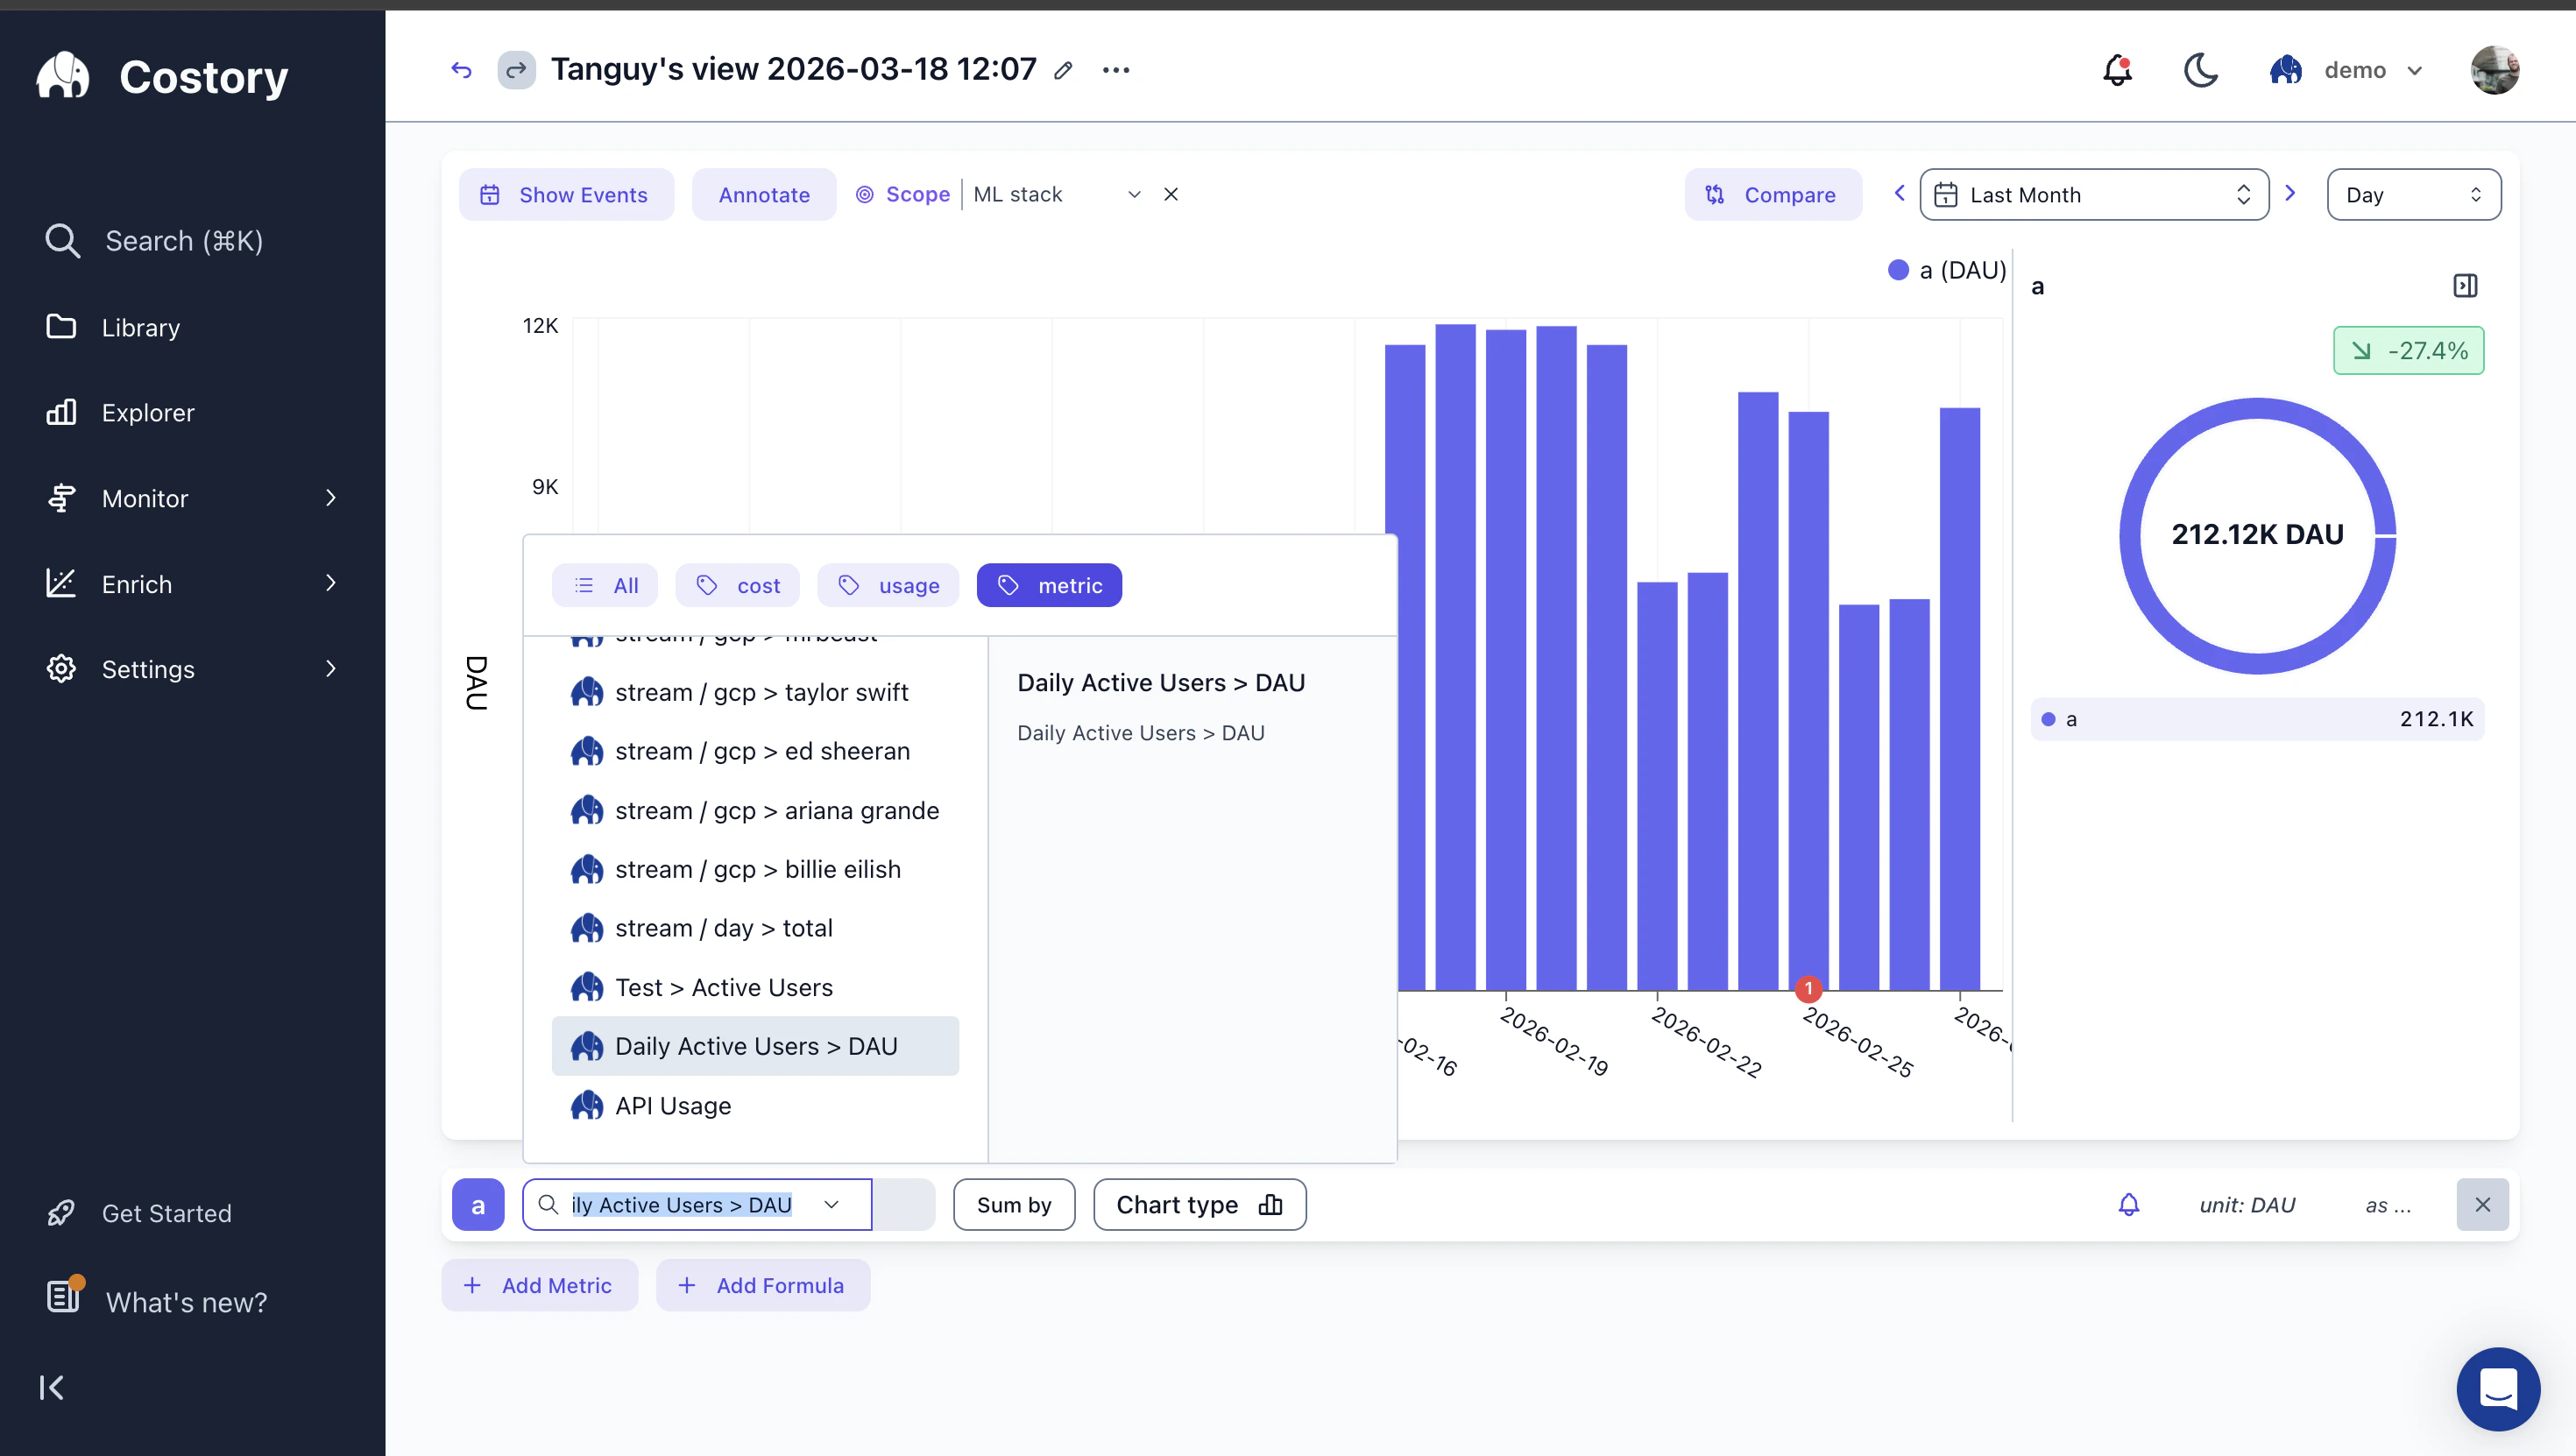
 Metrics from sources such as Datadog, Amplitude, BigQuery, CSV, or Google Sheets. These describe business or application activity that you correlate with cloud cost.
 ## Prerequisites
To build formulas from business or application activity, connect at least one [usage metrics source](/setup/usage-metrics). Supported sources include:
* [Datadog](/setup/usage-metrics/datadog) for infrastructure and application metrics
* [Amplitude](/setup/usage-metrics/amplitude) for product analytics such as DAU, MAU, and sessions
* [BigQuery](/setup/usage-metrics/bigquery) for warehouse-native metrics
* [CSV](/setup/usage-metrics/csv) or [Google Sheets](/setup/usage-metrics/google-sheet) for manual imports
You can still use formulas without external metrics. Combine cost fields with usage metrics from billing data, such as cost per GB-Hour, without connecting another source.
## Create a unit economics formula
Navigate to [Explorer](/features/cost-explorer) and configure the cost query you want to analyze.
Click **+ Add Metric** in the query bar to add a cost metric, usage metric, or external metric. Each metric gets a letter label that you reference in formulas.
Click **+ Add Formula** and write your formula with the metric labels.
Examples:
* If metric **a** is total cost and metric **b** is GB-Hours, `a / b` gives you cost per GB-Hour.
* If metric **a** is total cost and metric **b** is Daily Active Users, `a / b` gives you cost per DAU.
## Prerequisites
To build formulas from business or application activity, connect at least one [usage metrics source](/setup/usage-metrics). Supported sources include:
* [Datadog](/setup/usage-metrics/datadog) for infrastructure and application metrics
* [Amplitude](/setup/usage-metrics/amplitude) for product analytics such as DAU, MAU, and sessions
* [BigQuery](/setup/usage-metrics/bigquery) for warehouse-native metrics
* [CSV](/setup/usage-metrics/csv) or [Google Sheets](/setup/usage-metrics/google-sheet) for manual imports
You can still use formulas without external metrics. Combine cost fields with usage metrics from billing data, such as cost per GB-Hour, without connecting another source.
## Create a unit economics formula
Navigate to [Explorer](/features/cost-explorer) and configure the cost query you want to analyze.
Click **+ Add Metric** in the query bar to add a cost metric, usage metric, or external metric. Each metric gets a letter label that you reference in formulas.
Click **+ Add Formula** and write your formula with the metric labels.
Examples:
* If metric **a** is total cost and metric **b** is GB-Hours, `a / b` gives you cost per GB-Hour.
* If metric **a** is total cost and metric **b** is Daily Active Users, `a / b` gives you cost per DAU.
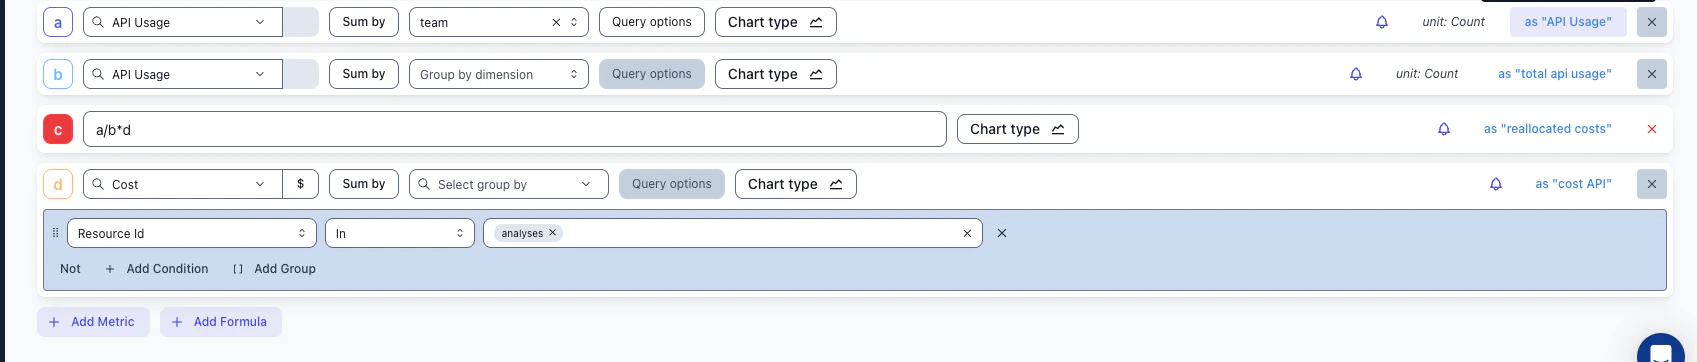 Formulas support `+`, `-`, `*`, `/`, and parentheses. For rolling averages or conditional logic, pre-compute the metric in your source system before importing it.
The chart updates to show the formula over time. Switch chart types and toggle between raw metrics and the formula output.
Formulas support `+`, `-`, `*`, `/`, and parentheses. For rolling averages or conditional logic, pre-compute the metric in your source system before importing it.
The chart updates to show the formula over time. Switch chart types and toggle between raw metrics and the formula output.
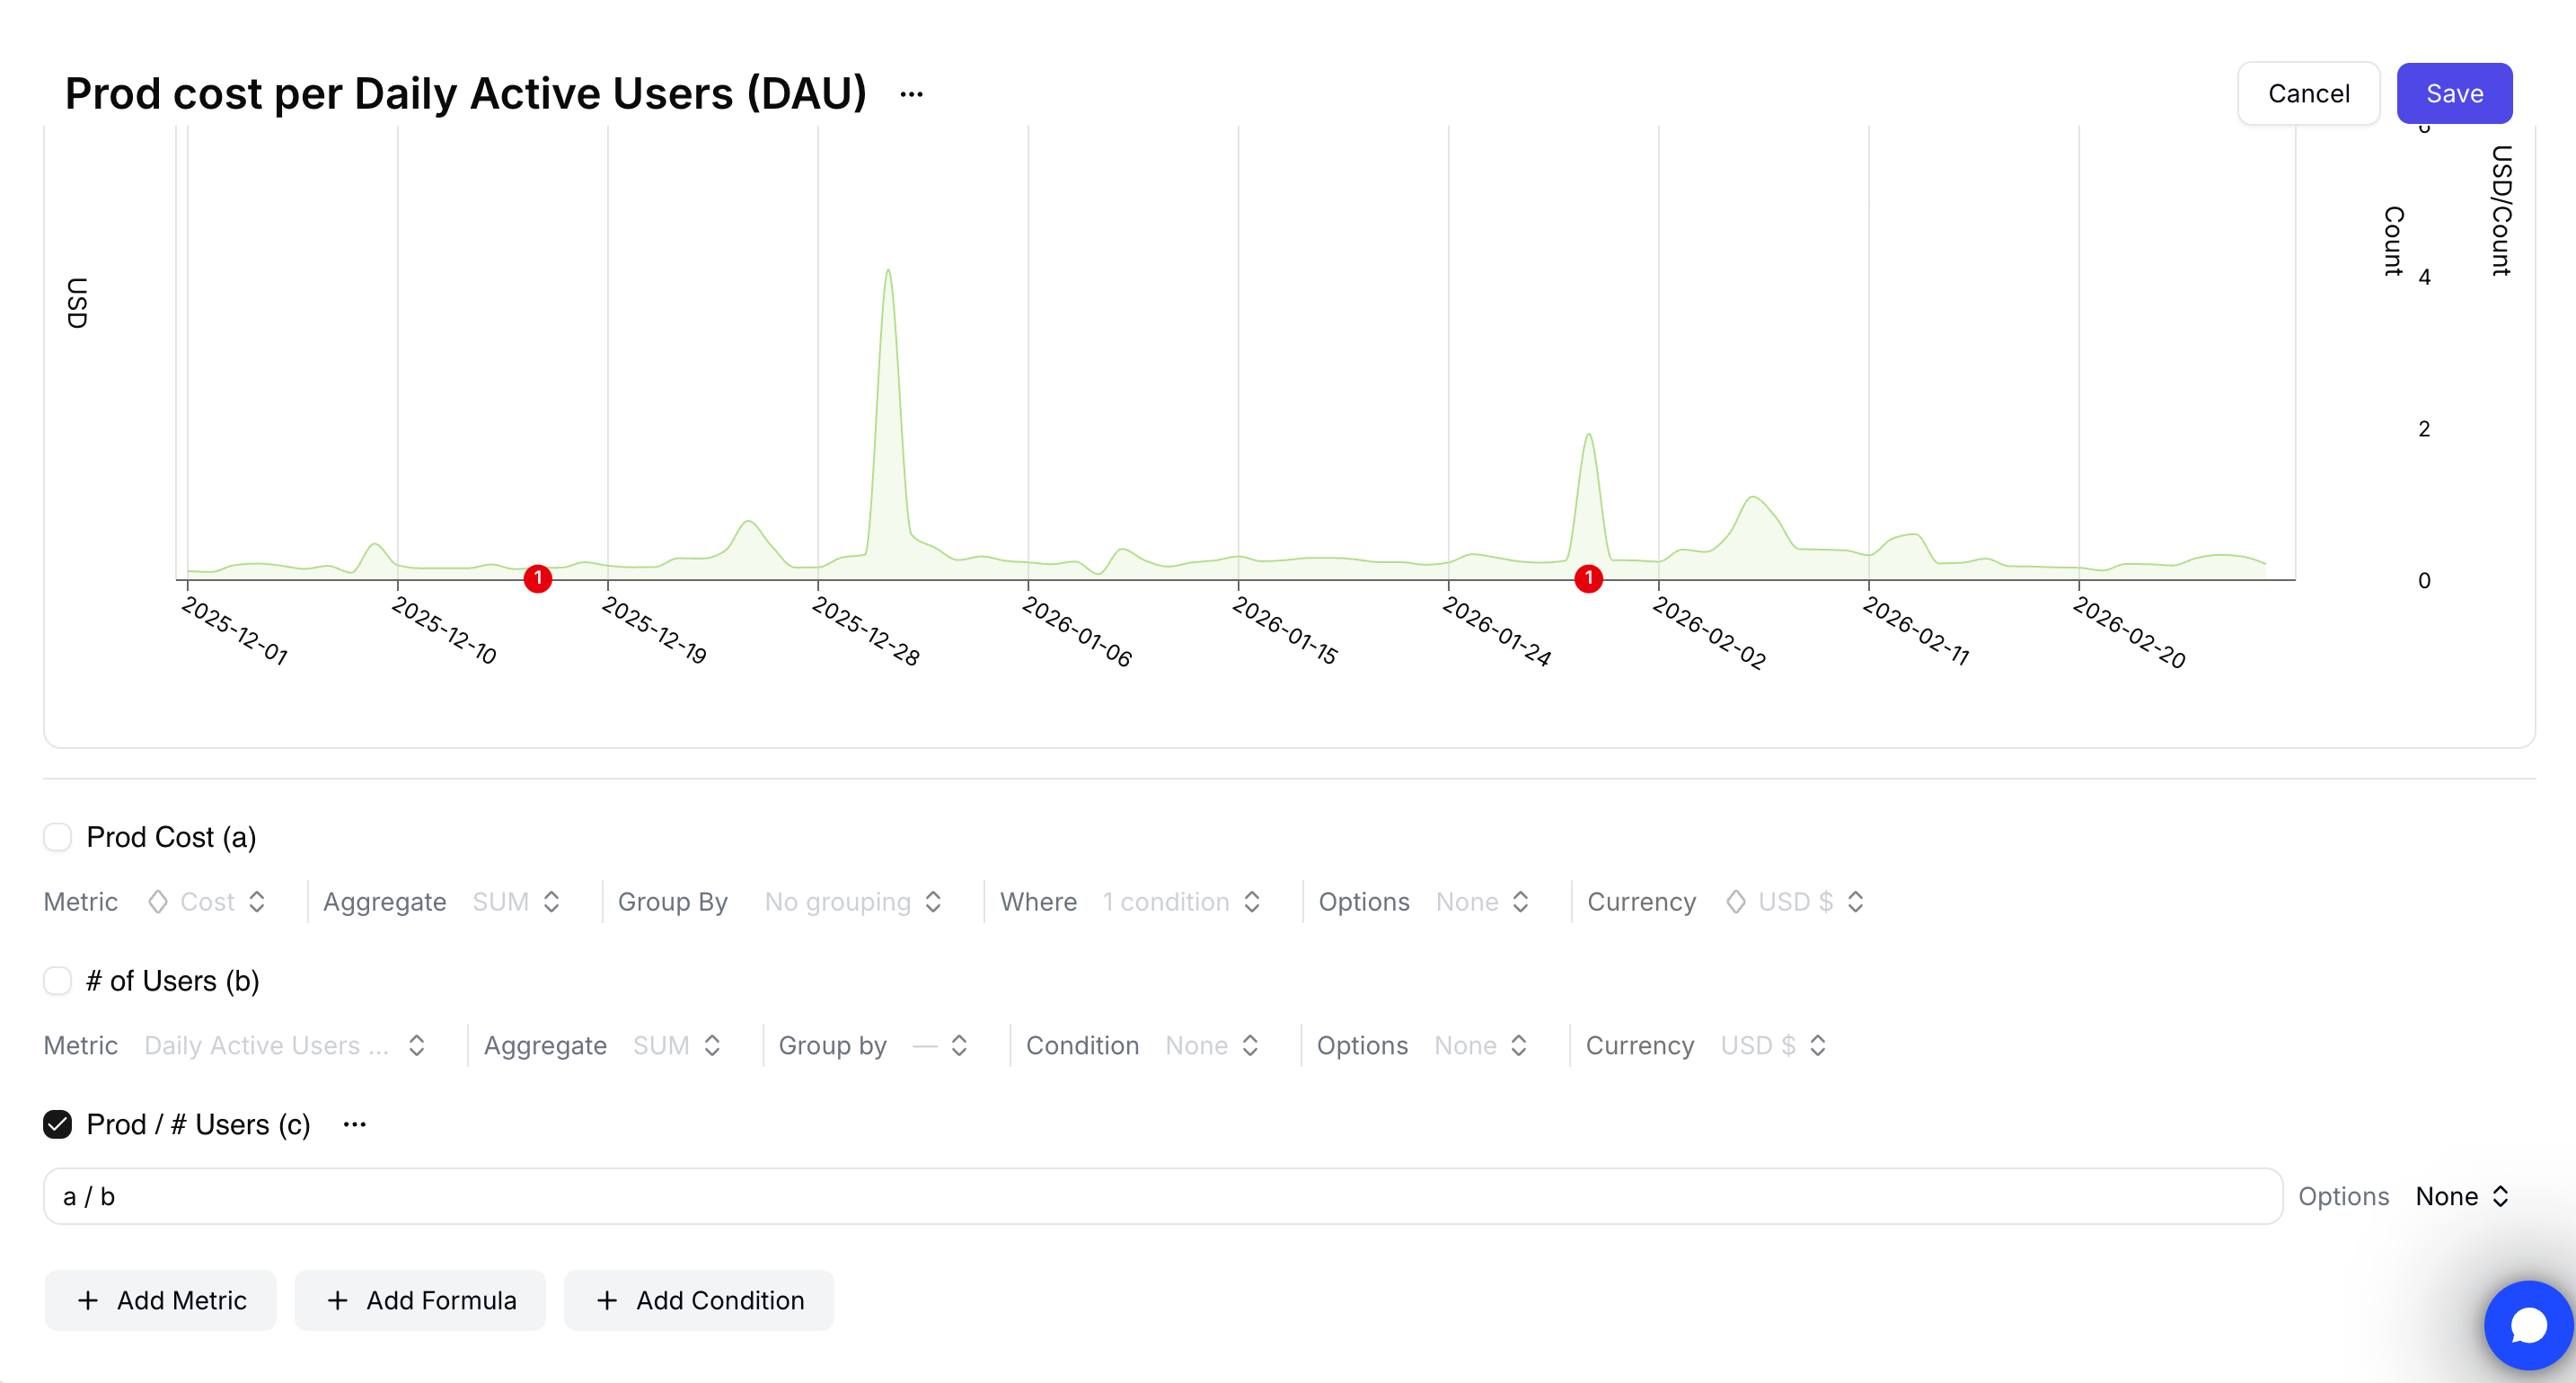 Save the query as a [dashboard widget](/features/dashboards/create-dashboard) so you can revisit it, share it with [Quick Share](/features/dashboards/quickshare), or schedule it as a [Cost Report](/features/slack-reports).
Formulas respect your group-by dimensions. If you group by team and define `cost / daily_active_users`, Costory returns a separate cost-per-DAU value for each team.
You can ask the [Costory MCP](/features/mcp) to build the ratio for you: *"show cost per active user this quarter, broken down by service."* It picks the right usage metric and returns the result you can save as a widget.
You can set threshold alerts on any formula. If cost per request exceeds your target, Costory sends a notification through Slack or email. Configure thresholds in [cloud cost alerts](/features/alerts).
## Frequently asked questions
Connect a usage metric such as DAU from Amplitude or transactions from your database. In Explorer, create a formula that divides cloud spend by that metric. For a full walkthrough, see [cost per active user with Amplitude](/use-cases/amplitude/cost_per_active_users).
Yes. If you group by a dimension such as team or service, the formula is applied per group. This lets you compare unit economics across teams, services, or products.
Formulas support arithmetic operators (`+`, `-`, `*`, `/`) and parentheses. Each metric is referenced by its letter label. Formulas operate on the aggregated value per time bucket.
Yes. Save the formula and create an alert from it. Use this for targets such as cost per request, cost per active user, or cost per build minute.
## Related links
Build the base cost queries for unit economics.
Connect business and application metrics.
Add timeline context to cost changes.
Follow a worked example with Amplitude.
Save the query as a [dashboard widget](/features/dashboards/create-dashboard) so you can revisit it, share it with [Quick Share](/features/dashboards/quickshare), or schedule it as a [Cost Report](/features/slack-reports).
Formulas respect your group-by dimensions. If you group by team and define `cost / daily_active_users`, Costory returns a separate cost-per-DAU value for each team.
You can ask the [Costory MCP](/features/mcp) to build the ratio for you: *"show cost per active user this quarter, broken down by service."* It picks the right usage metric and returns the result you can save as a widget.
You can set threshold alerts on any formula. If cost per request exceeds your target, Costory sends a notification through Slack or email. Configure thresholds in [cloud cost alerts](/features/alerts).
## Frequently asked questions
Connect a usage metric such as DAU from Amplitude or transactions from your database. In Explorer, create a formula that divides cloud spend by that metric. For a full walkthrough, see [cost per active user with Amplitude](/use-cases/amplitude/cost_per_active_users).
Yes. If you group by a dimension such as team or service, the formula is applied per group. This lets you compare unit economics across teams, services, or products.
Formulas support arithmetic operators (`+`, `-`, `*`, `/`) and parentheses. Each metric is referenced by its letter label. Formulas operate on the aggregated value per time bucket.
Yes. Save the formula and create an alert from it. Use this for targets such as cost per request, cost per active user, or cost per build minute.
## Related links
Build the base cost queries for unit economics.
Connect business and application metrics.
Add timeline context to cost changes.
Follow a worked example with Amplitude.