> ## Documentation Index
> Fetch the complete documentation index at: https://docs.costory.io/llms.txt
> Use this file to discover all available pages before exploring further.
# Custom Metrics Push
> Push hourly custom metrics to Costory over HTTP with an organization API key, then query them in Advanced Explorer, MCP, and virtual dimensions.
Push your own hourly metrics when the signal lives in a cron job, a sidecar, or a warehouse Costory cannot query live. Create a **Custom metrics** integration, POST points with an organization API key, then use them in [Advanced Explorer](/setup/usage-metrics#query-after-you-connect) like any other external metric.
Use this when you need to:
* Overlay a business counter (orders, jobs, active tenants) that only your app computes, then chart unit economics such as cost per order
* Drive [shared cost allocation](/features/tagging/shared-cost-allocation) from a usage key you already emit
* Backfill historical hourly points onto the same path your hourly job uses
 Before you begin, make sure you have:
* Admin access in Costory (creating the integration is admin-only)
* An **organization** API key (`ak_*`) from [API Keys](/get-started/settings). User keys and browser sessions return 401 on ingest
* Metrics already aggregated to the hour. Costory truncates every timestamp to the hour in UTC
Open **API Keys** from the menu next to your name. Create an **organization** token (admins only). Store it as `COSTORY_ORG_API_KEY`. User-scoped tokens and session cookies cannot ingest points. See [API overview](/api-reference/overview).
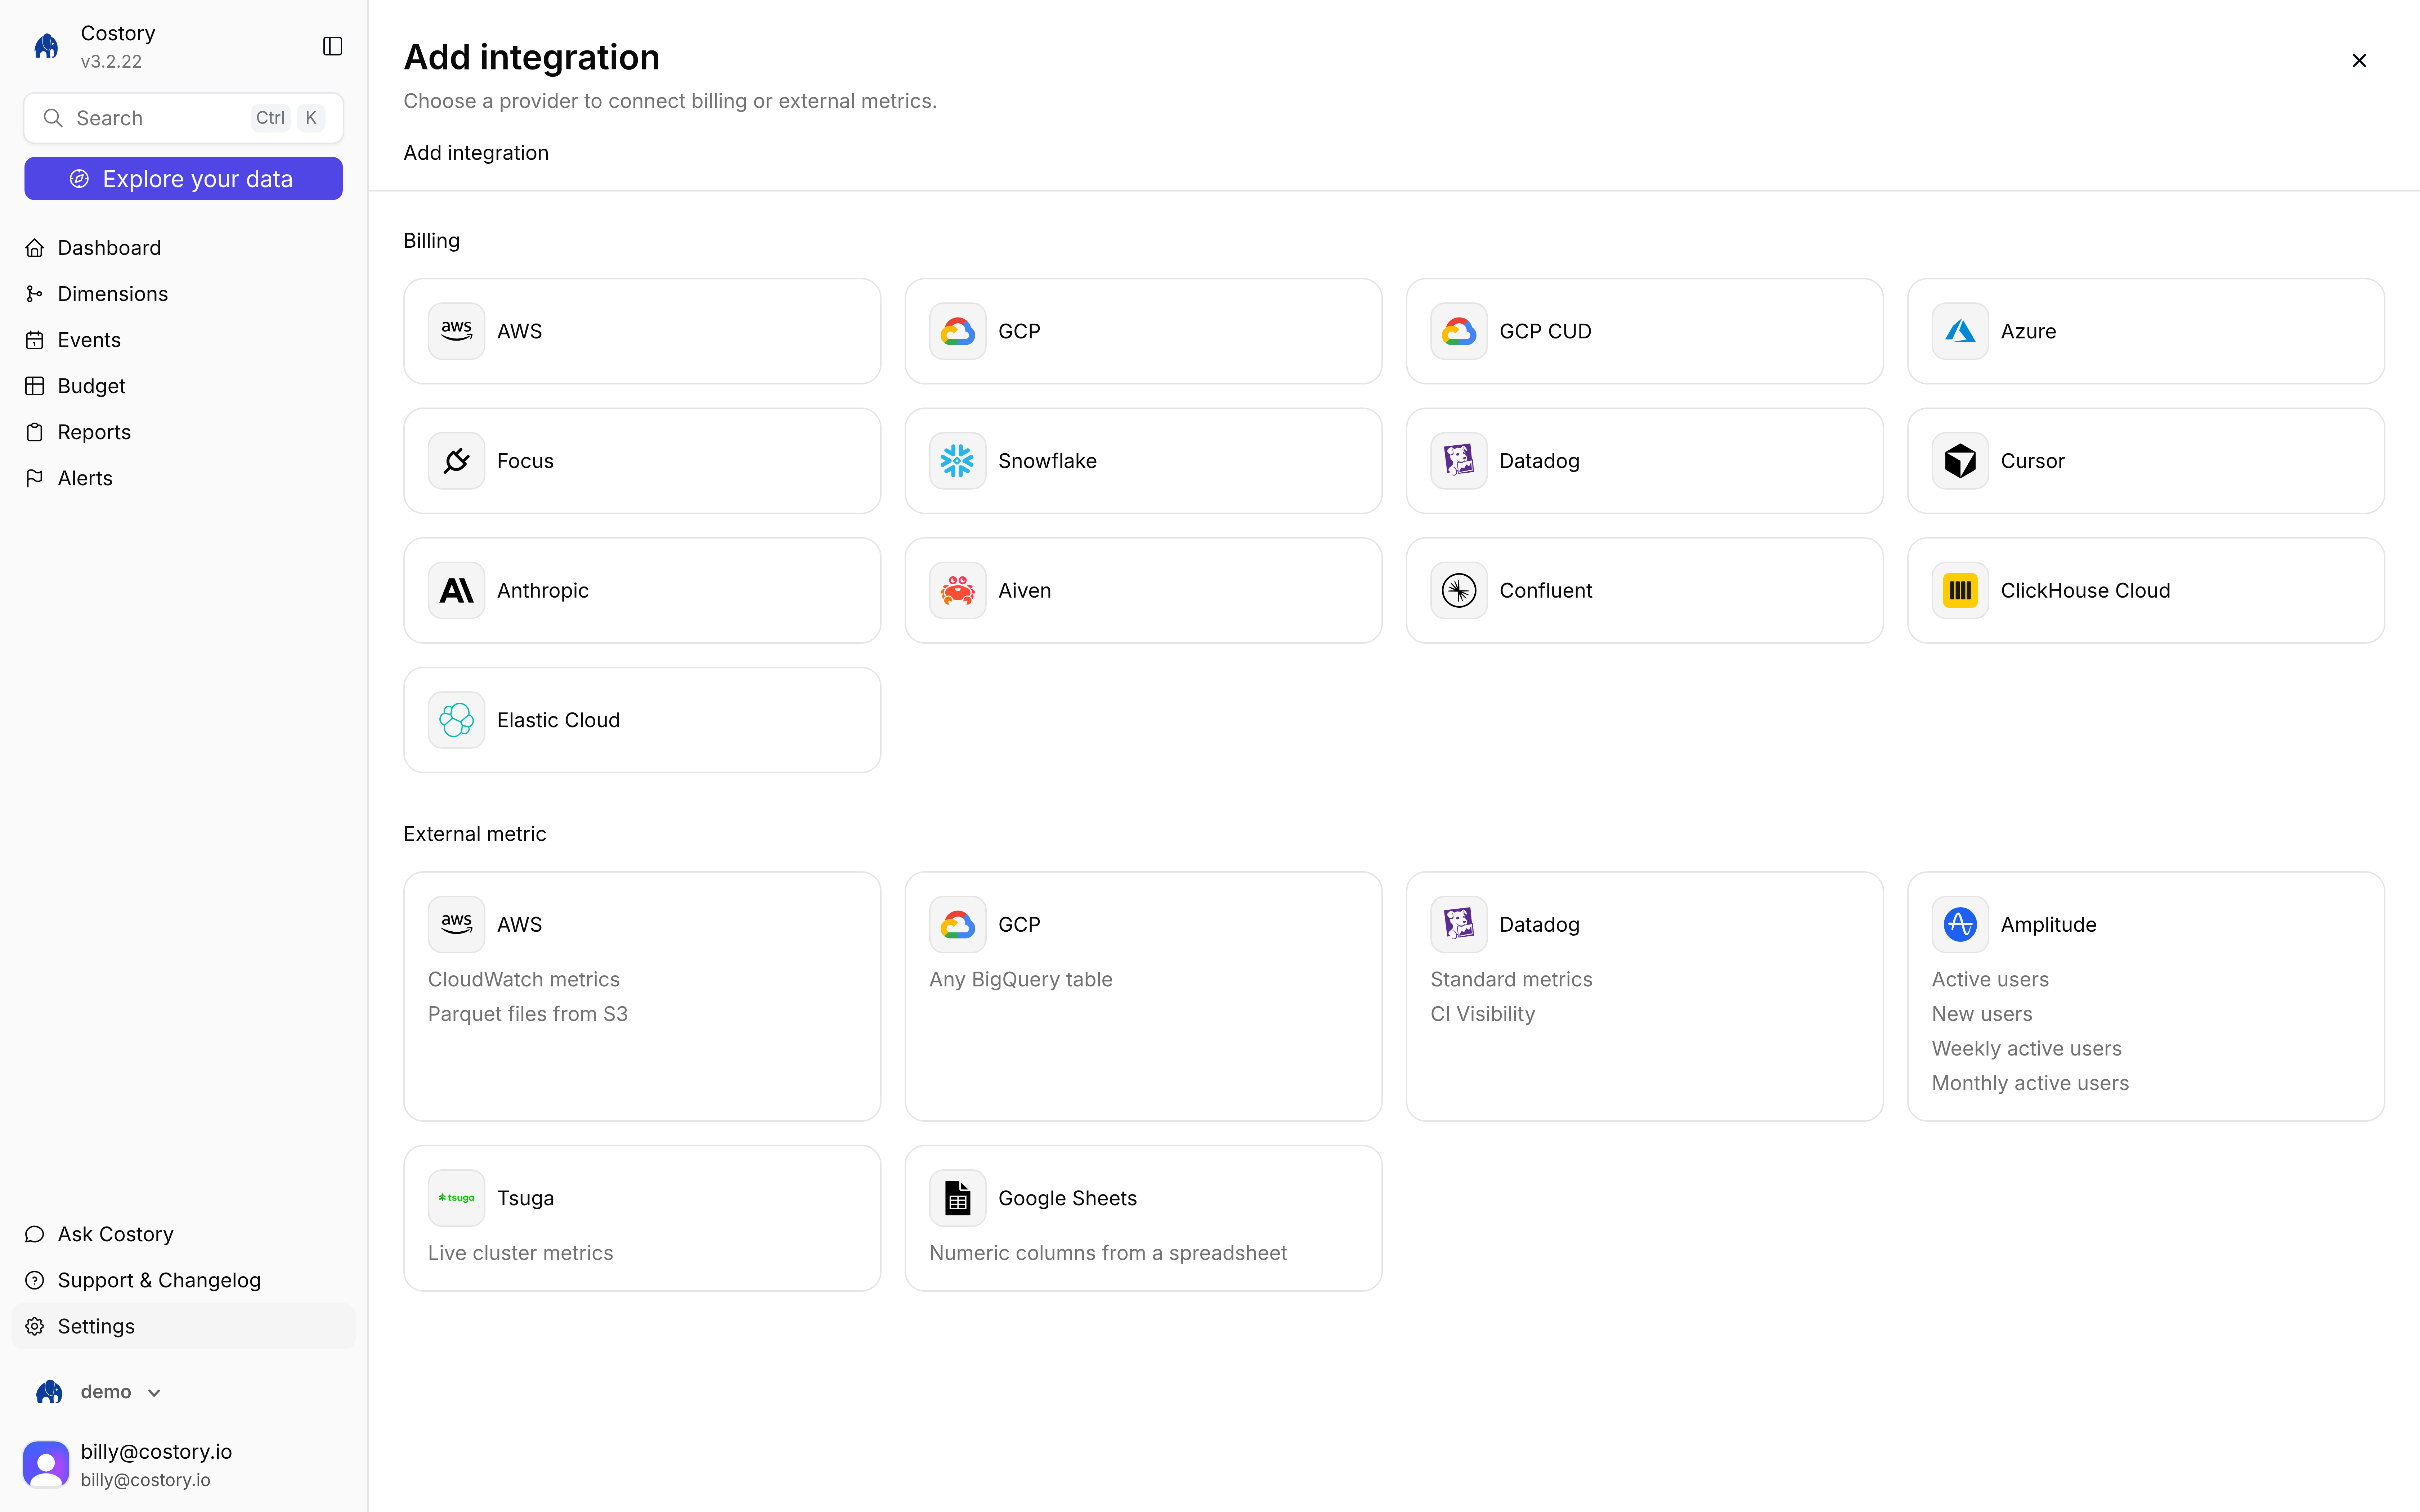
Go to [Integrations](https://app.costory.io/integration), click **+ Add integration**, then under **External metric** choose **Custom metrics**. The tile is **Hourly points you push over HTTP**. The connect URL is `/integration/new/custom-metrics/push`.
Set **Connection name** (default **Custom metrics**), then click **Save connection**. There is no **Validate** step. Costory creates an empty table for this integration. No vendor credentials.
After save, Costory shows **Custom metrics is ready**, the **Integration id**, and a curl example. Keep the id. You can open **Show details** later from the integration menu.
Send one or more points to `POST /integrations/:id/metrics/points`. Hourly jobs send one point. Backfill sends up to 10,000 on the same path.
```bash theme={null}
curl -X POST "https://app-api.costory.io/integrations/YOUR_INTEGRATION_ID/metrics/points" \
-H "Authorization: Bearer $COSTORY_ORG_API_KEY" \
-H "Content-Type: application/json" \
-d '{"points":[{"metric_name":"orders","ts":"2026-09-02T15:00:00Z","value":42,"tags":{"env":"prod"}}]}'
```
A successful write returns `202` with `inserted` (rows after in-batch dedupe) and `truncatedHours` (distinct hour buckets written).
Ingest does not update the metric picker. After the first push, open the integration menu and click **Refresh metrics**. New metric names and tag keys appear in **Advanced Explorer** after that refresh. Metrics that stop reporting stay in the catalog so saved queries keep resolving.
Click **Explore your data**, switch to **Advanced**, then **+ Add Metric**. Open **integrations** and pick the **Custom metrics** source. Group by tag keys from the points you pushed. See [Query after you connect](/setup/usage-metrics#query-after-you-connect).
## Point payload
Each request body is `{ "points": [ ... ] }` with 1 to 10,000 points.
| Field | Type | Rules |
| ------------- | -------------------------------------------------------- | ---------------------------------------------------------------------------------------------------------------------------------------------------------------------------------------------------------------- |
| `metric_name` | string | 1 to 255 characters. No control characters. Opaque: Costory does not enforce a Prometheus name charset. |
| `ts` | ISO-8601 datetime with offset, or epoch **milliseconds** | Truncated to the hour in UTC before insert. Unix seconds (a \~1e9 number) are rejected. |
| `value` | number | Finite. `NaN` and infinity return 400. |
| `tags` | object | Optional. Defaults to `{}`. Keys must be SQL identifiers: start with a letter or `_`, then letters, digits, or `_` (max 128). Values are string, number, or boolean. Nested objects and arrays are not accepted. |
Tag keys become Explorer group-bys. A key such as `env-name` is rejected because it is not a valid identifier.
The last write for the same `metric_name`, hour, and tags wins. If one request repeats that key, the last array element is kept. Retrying a failed request can insert duplicates. Query-time last-write-wins hides them.
## Python example
```python theme={null}
import os
import requests
integration_id = os.environ["COSTORY_CUSTOM_METRICS_ID"]
payload = {
"points": [
{
"metric_name": "orders",
"ts": "2026-09-02T15:00:00Z",
"value": 42,
"tags": {"env": "prod"},
}
]
}
response = requests.post(
f"https://app-api.costory.io/integrations/{integration_id}/metrics/points",
headers={
"Authorization": f"Bearer {os.environ['COSTORY_ORG_API_KEY']}",
"Content-Type": "application/json",
},
json=payload,
timeout=10,
)
response.raise_for_status()
print(response.json())
```
## After you save
On the source row menu you can:
* **Show details** (integration id and curl again)
* **Refresh metrics** (catalog only, admin)
* **Remove Custom metrics integration** (admin). Removal drops the table and catalog rows for that integration.
You can create more than one Custom metrics integration per organization, for example staging versus production push sources.
Query the series through [Costory MCP](/features/mcp) as well: `list_metrics` returns the catalog, and `query` accepts `{ type: "externalMetric", integrationId, metricName }`.
Tag filters (`conditions`) are not available on Custom metrics in this version. Split series with group-by on tag keys instead.
Not supported.
## Prometheus
Costory does not speak Prometheus remote-write. Run a sidecar next to Prometheus that maps name, timestamp, labels, and value onto this POST. Preaggregate to the hour before you send. Cron and sidecars must use the organization API key, not a session cookie.
## FAQ
The ingest path accepts only a Clerk **organization** API key (`ak_*` with an `org_*` subject). User API keys, session JWTs, and Swagger session auth return 401, even for admins. Create the token under **API Keys** as an organization token. See [API overview](/api-reference/overview).
Click **Refresh metrics** on the integration menu. The catalog is not updated on ingest. Then pick the **Custom metrics** source under **integrations** and confirm the **Period** covers hours you wrote.
Yes. Costory truncates them to the hour in UTC. Preaggregate in your job if several samples in the same hour should not collapse to the last write.
No. A numeric `ts` must be epoch milliseconds (12+ digits after 2001). Seconds look like `1750000000` and are rejected so they are not stored as 1970.
The later `inserted_at` wins for that metric name, hour, and tags. Explorer shows the last value.
No. This connector only accepts HTTP POST. If the data already lives in BigQuery or Snowflake, use [BigQuery](/setup/usage-metrics/bigquery) or [Snowflake Metrics](/setup/usage-metrics/snowflake) instead.
## Related pages
All external metric sources and the Explorer query path.
Divide cloud cost by a metric you push.
Split shared costs with a usage metric.
Create an organization API key for ingest.
Before you begin, make sure you have:
* Admin access in Costory (creating the integration is admin-only)
* An **organization** API key (`ak_*`) from [API Keys](/get-started/settings). User keys and browser sessions return 401 on ingest
* Metrics already aggregated to the hour. Costory truncates every timestamp to the hour in UTC
Open **API Keys** from the menu next to your name. Create an **organization** token (admins only). Store it as `COSTORY_ORG_API_KEY`. User-scoped tokens and session cookies cannot ingest points. See [API overview](/api-reference/overview).
Go to [Integrations](https://app.costory.io/integration), click **+ Add integration**, then under **External metric** choose **Custom metrics**. The tile is **Hourly points you push over HTTP**. The connect URL is `/integration/new/custom-metrics/push`.
Set **Connection name** (default **Custom metrics**), then click **Save connection**. There is no **Validate** step. Costory creates an empty table for this integration. No vendor credentials.
After save, Costory shows **Custom metrics is ready**, the **Integration id**, and a curl example. Keep the id. You can open **Show details** later from the integration menu.
Send one or more points to `POST /integrations/:id/metrics/points`. Hourly jobs send one point. Backfill sends up to 10,000 on the same path.
```bash theme={null}
curl -X POST "https://app-api.costory.io/integrations/YOUR_INTEGRATION_ID/metrics/points" \
-H "Authorization: Bearer $COSTORY_ORG_API_KEY" \
-H "Content-Type: application/json" \
-d '{"points":[{"metric_name":"orders","ts":"2026-09-02T15:00:00Z","value":42,"tags":{"env":"prod"}}]}'
```
A successful write returns `202` with `inserted` (rows after in-batch dedupe) and `truncatedHours` (distinct hour buckets written).
Ingest does not update the metric picker. After the first push, open the integration menu and click **Refresh metrics**. New metric names and tag keys appear in **Advanced Explorer** after that refresh. Metrics that stop reporting stay in the catalog so saved queries keep resolving.
Click **Explore your data**, switch to **Advanced**, then **+ Add Metric**. Open **integrations** and pick the **Custom metrics** source. Group by tag keys from the points you pushed. See [Query after you connect](/setup/usage-metrics#query-after-you-connect).
## Point payload
Each request body is `{ "points": [ ... ] }` with 1 to 10,000 points.
| Field | Type | Rules |
| ------------- | -------------------------------------------------------- | ---------------------------------------------------------------------------------------------------------------------------------------------------------------------------------------------------------------- |
| `metric_name` | string | 1 to 255 characters. No control characters. Opaque: Costory does not enforce a Prometheus name charset. |
| `ts` | ISO-8601 datetime with offset, or epoch **milliseconds** | Truncated to the hour in UTC before insert. Unix seconds (a \~1e9 number) are rejected. |
| `value` | number | Finite. `NaN` and infinity return 400. |
| `tags` | object | Optional. Defaults to `{}`. Keys must be SQL identifiers: start with a letter or `_`, then letters, digits, or `_` (max 128). Values are string, number, or boolean. Nested objects and arrays are not accepted. |
Tag keys become Explorer group-bys. A key such as `env-name` is rejected because it is not a valid identifier.
The last write for the same `metric_name`, hour, and tags wins. If one request repeats that key, the last array element is kept. Retrying a failed request can insert duplicates. Query-time last-write-wins hides them.
## Python example
```python theme={null}
import os
import requests
integration_id = os.environ["COSTORY_CUSTOM_METRICS_ID"]
payload = {
"points": [
{
"metric_name": "orders",
"ts": "2026-09-02T15:00:00Z",
"value": 42,
"tags": {"env": "prod"},
}
]
}
response = requests.post(
f"https://app-api.costory.io/integrations/{integration_id}/metrics/points",
headers={
"Authorization": f"Bearer {os.environ['COSTORY_ORG_API_KEY']}",
"Content-Type": "application/json",
},
json=payload,
timeout=10,
)
response.raise_for_status()
print(response.json())
```
## After you save
On the source row menu you can:
* **Show details** (integration id and curl again)
* **Refresh metrics** (catalog only, admin)
* **Remove Custom metrics integration** (admin). Removal drops the table and catalog rows for that integration.
You can create more than one Custom metrics integration per organization, for example staging versus production push sources.
Query the series through [Costory MCP](/features/mcp) as well: `list_metrics` returns the catalog, and `query` accepts `{ type: "externalMetric", integrationId, metricName }`.
Tag filters (`conditions`) are not available on Custom metrics in this version. Split series with group-by on tag keys instead.
Not supported.
## Prometheus
Costory does not speak Prometheus remote-write. Run a sidecar next to Prometheus that maps name, timestamp, labels, and value onto this POST. Preaggregate to the hour before you send. Cron and sidecars must use the organization API key, not a session cookie.
## FAQ
The ingest path accepts only a Clerk **organization** API key (`ak_*` with an `org_*` subject). User API keys, session JWTs, and Swagger session auth return 401, even for admins. Create the token under **API Keys** as an organization token. See [API overview](/api-reference/overview).
Click **Refresh metrics** on the integration menu. The catalog is not updated on ingest. Then pick the **Custom metrics** source under **integrations** and confirm the **Period** covers hours you wrote.
Yes. Costory truncates them to the hour in UTC. Preaggregate in your job if several samples in the same hour should not collapse to the last write.
No. A numeric `ts` must be epoch milliseconds (12+ digits after 2001). Seconds look like `1750000000` and are rejected so they are not stored as 1970.
The later `inserted_at` wins for that metric name, hour, and tags. Explorer shows the last value.
No. This connector only accepts HTTP POST. If the data already lives in BigQuery or Snowflake, use [BigQuery](/setup/usage-metrics/bigquery) or [Snowflake Metrics](/setup/usage-metrics/snowflake) instead.
## Related pages
All external metric sources and the Explorer query path.
Divide cloud cost by a metric you push.
Split shared costs with a usage metric.
Create an organization API key for ingest.