> ## Documentation Index
> Fetch the complete documentation index at: https://docs.costory.io/llms.txt
> Use this file to discover all available pages before exploring further.
# GCP Cloud Monitoring
> Connect Google Cloud Monitoring as a live external metric in Costory. Grant Monitoring Viewer, validate a project, then query GCP metrics in Advanced Explorer.
Connect Google Cloud Monitoring when your usage signal already lives in GCP: GKE CPU, Cloud Storage bytes, Cloud SQL connections, Compute Engine utilization, or a custom metric. Costory queries the Monitoring API live and plots those series next to cost in [Advanced Explorer](/setup/usage-metrics#query-after-you-connect). It does not copy metric data.
On **Add integration**, the **GCP** tile lists **Any BigQuery table** and **Cloud Monitoring metrics**. Choose **Cloud Monitoring**. For tables, see [BigQuery](/setup/usage-metrics/bigquery).
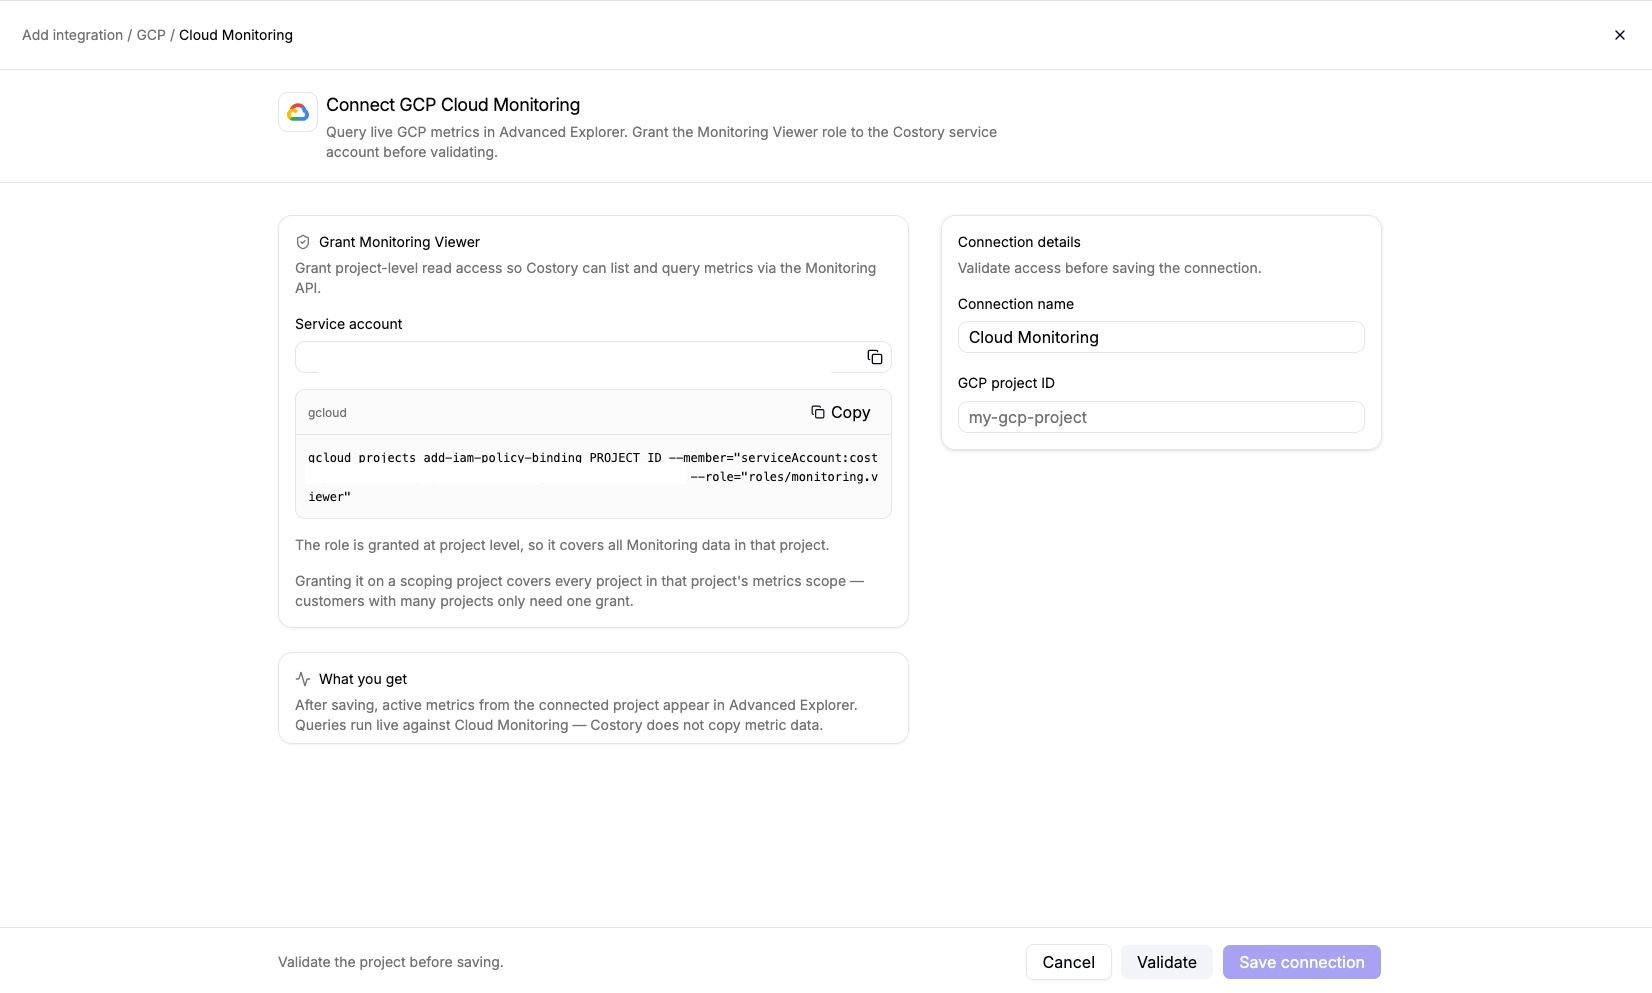 Go to [Integrations](https://app.costory.io/integration), click **+ Add integration**, then under **External metric** choose **GCP**. On **Choose what to connect**, pick **Cloud Monitoring**. The connect URL is `/integration/new/gcp/cloud-monitoring`. You need to be an admin.
Copy the **Service account** from the connect screen. Grant project-level **Monitoring Viewer** (`roles/monitoring.viewer`) so Costory can list and query metrics. The role is read-only. It covers every Monitoring series in that project. You cannot scope it to a single metric.
Run the command shown under **gcloud**, or paste this and replace the placeholders:
```bash theme={null}
gcloud projects add-iam-policy-binding PROJECT_ID \
--member="serviceAccount:SERVICE_ACCOUNT_EMAIL" \
--role="roles/monitoring.viewer"
```
The **GCP project ID** you enter updates the command on the page.
Set **Connection name** (default **Cloud Monitoring**) and **GCP project ID**. Click **Validate**. Costory lists active metrics in the project's metrics scope and shows a count such as **Found 42 active metrics in this project's metrics scope.** Click **Save connection**.
**Save connection** stays disabled until validation succeeds.
Click **Explore your data**, switch **Classic** to **Advanced**, then **+ Add Metric**. Open **integrations** and pick the Cloud Monitoring source. Search a metric type. The picker shows the path after the service domain, for example `instance/cpu/utilization` for `compute.googleapis.com/instance/cpu/utilization`.
See [Query after you connect](/setup/usage-metrics#query-after-you-connect).
Enable the Cloud Monitoring API (`monitoring.googleapis.com`) on the project before you validate. A disabled API fails with a permission-style error.
Grant the role on a [scoping project](https://cloud.google.com/monitoring/settings) if you use a metrics scope. That one grant covers every project in the scope. You can then group by `resource.label.project_id` instead of connecting each project.
## Connection fields
| Field | Description | Default |
| ------------------- | ----------------------------------------------------------------------------------------------------------------- | ---------------- |
| **Connection name** | Label on the Integrations list and in the Explorer picker. | Cloud Monitoring |
| **GCP project ID** | Project Costory calls on the Monitoring API. Use the scoping project if you monitor many projects from one scope. | (empty) |
## What you can query
After you save, active metrics from the connected project appear under **integrations**. Queries run against Cloud Monitoring. Costory does not store the timeseries.
Go to [Integrations](https://app.costory.io/integration), click **+ Add integration**, then under **External metric** choose **GCP**. On **Choose what to connect**, pick **Cloud Monitoring**. The connect URL is `/integration/new/gcp/cloud-monitoring`. You need to be an admin.
Copy the **Service account** from the connect screen. Grant project-level **Monitoring Viewer** (`roles/monitoring.viewer`) so Costory can list and query metrics. The role is read-only. It covers every Monitoring series in that project. You cannot scope it to a single metric.
Run the command shown under **gcloud**, or paste this and replace the placeholders:
```bash theme={null}
gcloud projects add-iam-policy-binding PROJECT_ID \
--member="serviceAccount:SERVICE_ACCOUNT_EMAIL" \
--role="roles/monitoring.viewer"
```
The **GCP project ID** you enter updates the command on the page.
Set **Connection name** (default **Cloud Monitoring**) and **GCP project ID**. Click **Validate**. Costory lists active metrics in the project's metrics scope and shows a count such as **Found 42 active metrics in this project's metrics scope.** Click **Save connection**.
**Save connection** stays disabled until validation succeeds.
Click **Explore your data**, switch **Classic** to **Advanced**, then **+ Add Metric**. Open **integrations** and pick the Cloud Monitoring source. Search a metric type. The picker shows the path after the service domain, for example `instance/cpu/utilization` for `compute.googleapis.com/instance/cpu/utilization`.
See [Query after you connect](/setup/usage-metrics#query-after-you-connect).
Enable the Cloud Monitoring API (`monitoring.googleapis.com`) on the project before you validate. A disabled API fails with a permission-style error.
Grant the role on a [scoping project](https://cloud.google.com/monitoring/settings) if you use a metrics scope. That one grant covers every project in the scope. You can then group by `resource.label.project_id` instead of connecting each project.
## Connection fields
| Field | Description | Default |
| ------------------- | ----------------------------------------------------------------------------------------------------------------- | ---------------- |
| **Connection name** | Label on the Integrations list and in the Explorer picker. | Cloud Monitoring |
| **GCP project ID** | Project Costory calls on the Monitoring API. Use the scoping project if you monitor many projects from one scope. | (empty) |
## What you can query
After you save, active metrics from the connected project appear under **integrations**. Queries run against Cloud Monitoring. Costory does not store the timeseries.
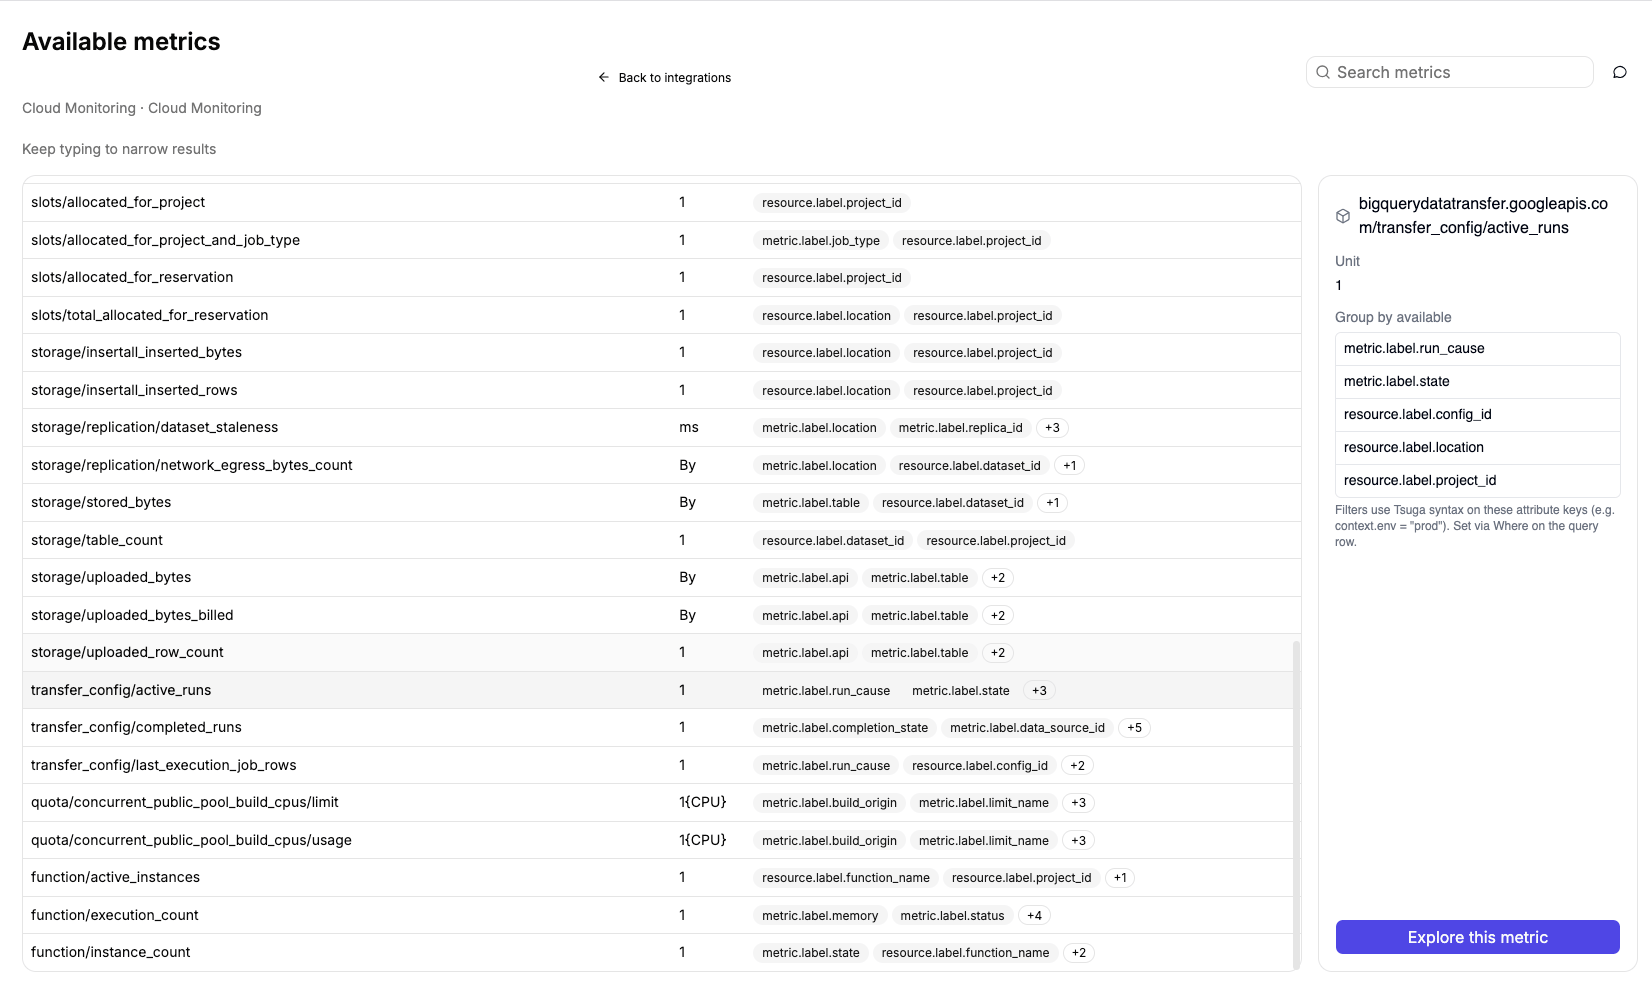 Common series:
* Compute Engine CPU utilization (`compute.googleapis.com/instance/cpu/utilization`)
* GKE container CPU request utilization (`kubernetes.io/container/cpu/request_utilization`)
* Cloud Storage object or byte counts (`storage.googleapis.com`)
* Cloud SQL connections or PostgreSQL insights execution time (`cloudsql.googleapis.com`)
* Custom or Prometheus metrics you already export to Cloud Monitoring
Set **Aggregate** to **SUM**, **AVERAGE**, **MAX**, or **MIN**. Optional **Group by** uses Monitoring labels, written as `metric.label.*` or `resource.label.*`. `resource.label.project_id` is always available.
To narrow the series, paste a Cloud Monitoring filter in the condition field. The field is not validated in the UI. Example:
```
resource.label.cluster_name = "prod-gke"
```
Costory always constrains the query to the metric you picked. Your filter is combined with that metric type.
Use the series in a [virtual dimension](/features/tagging/dimensions#virtual-dimensions) or [shared cost allocation](/features/tagging/shared-cost-allocation) rule after you can query it in Explorer. For formulas such as cost per request, see [Unit Economics](/features/unit-economics).
## Limits
| Topic | Details |
| ----------------------- | ------------------------------------------------------------------------------------------------------------------------------ |
| **Active metrics only** | Validation and the picker list metrics with data in roughly the last 25 hours. A project with no recent points fails validate. |
| **Numeric metrics** | `INT64` and `DOUBLE` values work. `DISTRIBUTION`, `BOOL`, `STRING`, and `MONEY` are not supported. |
| **Group-by cap** | Explorer keeps the 200 largest groups by magnitude. |
| **API billing** | Listing descriptors is free. Timeseries reads are billed to your GCP billing account. |
| **No PromQL** | Pick a metric and optional filter. There is no free-text PromQL or MQL box. |
## Troubleshooting
| Issue | What to check |
| --------------------------------------- | --------------------------------------------------------------------------------------------------------------------------------------- |
| **Permission denied** | Grant `roles/monitoring.viewer` to the Costory service account on the same project ID you entered. |
| **Cloud Monitoring API is not enabled** | Enable `monitoring.googleapis.com` on that project, then validate again. |
| **Project not found** | Confirm the project ID spelling and that the service account can see the project. |
| **No active metrics found** | The project (or scope) has no metrics with data in about the last 25 hours. Generate traffic or connect a project that already reports. |
| **Rate limited** | Wait a few minutes and retry. Check the project's Monitoring API quota if it keeps failing. |
| **Chart is empty** | Search the full metric type, change **Period**, and confirm the metric still has recent data. Classic greys out non-cost metrics. |
| **Metric missing from the picker** | Type part of the metric type. The first open is a short page of active metrics, not the full Google catalog. |
Not supported.
## Related pages
Query a table instead of the Monitoring API on the same GCP tile.
Query external metrics in Advanced Explorer.
Divide cloud cost by a Cloud Monitoring series.
Connect Detailed Usage Cost export for GCP spend.
Common series:
* Compute Engine CPU utilization (`compute.googleapis.com/instance/cpu/utilization`)
* GKE container CPU request utilization (`kubernetes.io/container/cpu/request_utilization`)
* Cloud Storage object or byte counts (`storage.googleapis.com`)
* Cloud SQL connections or PostgreSQL insights execution time (`cloudsql.googleapis.com`)
* Custom or Prometheus metrics you already export to Cloud Monitoring
Set **Aggregate** to **SUM**, **AVERAGE**, **MAX**, or **MIN**. Optional **Group by** uses Monitoring labels, written as `metric.label.*` or `resource.label.*`. `resource.label.project_id` is always available.
To narrow the series, paste a Cloud Monitoring filter in the condition field. The field is not validated in the UI. Example:
```
resource.label.cluster_name = "prod-gke"
```
Costory always constrains the query to the metric you picked. Your filter is combined with that metric type.
Use the series in a [virtual dimension](/features/tagging/dimensions#virtual-dimensions) or [shared cost allocation](/features/tagging/shared-cost-allocation) rule after you can query it in Explorer. For formulas such as cost per request, see [Unit Economics](/features/unit-economics).
## Limits
| Topic | Details |
| ----------------------- | ------------------------------------------------------------------------------------------------------------------------------ |
| **Active metrics only** | Validation and the picker list metrics with data in roughly the last 25 hours. A project with no recent points fails validate. |
| **Numeric metrics** | `INT64` and `DOUBLE` values work. `DISTRIBUTION`, `BOOL`, `STRING`, and `MONEY` are not supported. |
| **Group-by cap** | Explorer keeps the 200 largest groups by magnitude. |
| **API billing** | Listing descriptors is free. Timeseries reads are billed to your GCP billing account. |
| **No PromQL** | Pick a metric and optional filter. There is no free-text PromQL or MQL box. |
## Troubleshooting
| Issue | What to check |
| --------------------------------------- | --------------------------------------------------------------------------------------------------------------------------------------- |
| **Permission denied** | Grant `roles/monitoring.viewer` to the Costory service account on the same project ID you entered. |
| **Cloud Monitoring API is not enabled** | Enable `monitoring.googleapis.com` on that project, then validate again. |
| **Project not found** | Confirm the project ID spelling and that the service account can see the project. |
| **No active metrics found** | The project (or scope) has no metrics with data in about the last 25 hours. Generate traffic or connect a project that already reports. |
| **Rate limited** | Wait a few minutes and retry. Check the project's Monitoring API quota if it keeps failing. |
| **Chart is empty** | Search the full metric type, change **Period**, and confirm the metric still has recent data. Classic greys out non-cost metrics. |
| **Metric missing from the picker** | Type part of the metric type. The first open is a short page of active metrics, not the full Google catalog. |
Not supported.
## Related pages
Query a table instead of the Monitoring API on the same GCP tile.
Query external metrics in Advanced Explorer.
Divide cloud cost by a Cloud Monitoring series.
Connect Detailed Usage Cost export for GCP spend.