> ## Documentation Index
> Fetch the complete documentation index at: https://docs.costory.io/llms.txt
> Use this file to discover all available pages before exploring further.
# Cost Reports
> Schedule recurring cloud cost reports to Slack, Microsoft Teams, or email from a dashboard, widget, or Explorer view, in the UI, from chat, or via the API.
Cost dashboards only work if people see them. **Cost Reports** deliver multi-cloud cost breakdowns directly to Slack, Microsoft Teams, or email on a recurring schedule.
 ## Overview
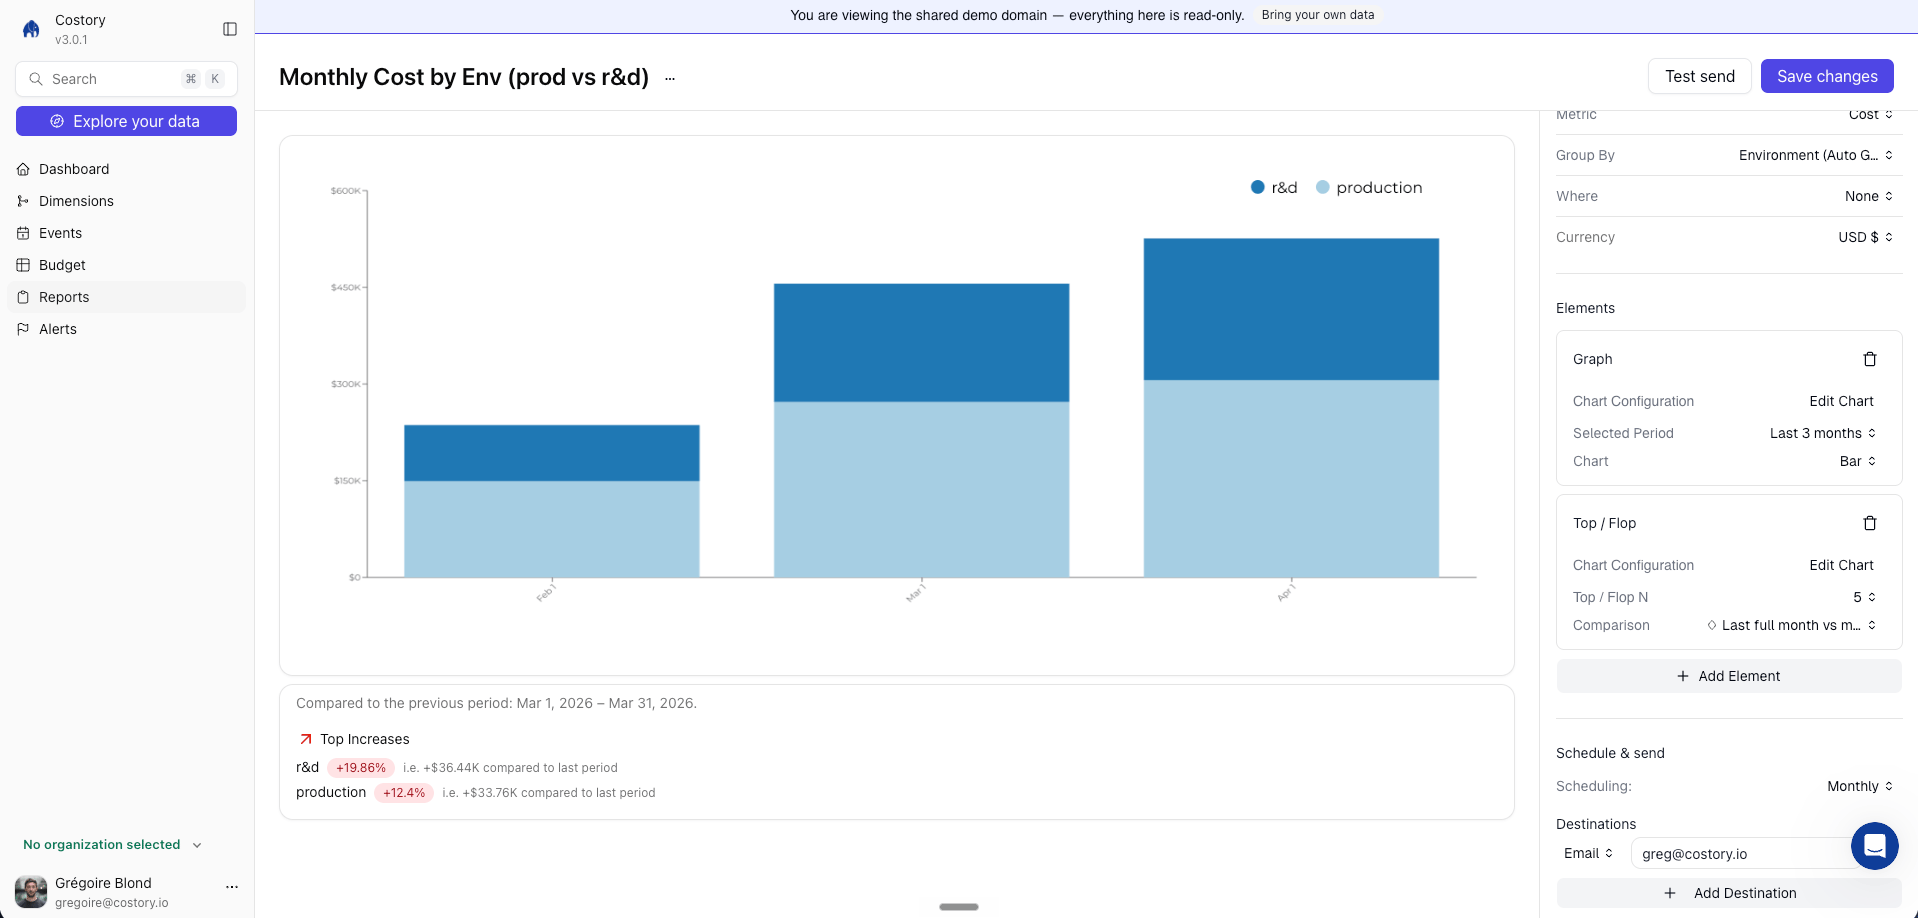
Cost Reports deliver a dashboard, dashboard widget, or Explorer-backed cost view as a formatted snapshot on a schedule you define. Each report includes the cost breakdown, a comparison against a previous period, and a direct link back to Costory.
Where it fits in your day-to-day:
* Sending weekly cost updates to each squad's Slack channel so engineers see their infrastructure spend without logging into a dashboard
* Delivering monthly executive summaries to leadership with pre-filtered views scoped to their business unit
* Keeping SRE and platform teams informed about infrastructure cost trends as part of their existing review cadence
## Get started
You can schedule a report from chat. Ask the [Costory MCP](/features/mcp) to *"send a weekly cost-by-team report to our #finops Slack channel"* and it creates the schedule against the view you describe.
Open the [dashboard](/features/dashboards), dashboard widget, or [Explorer](/features/cost-explorer) query you want to deliver on a schedule.
Open the action menu and select **Schedule Report**. This opens the scheduling
configuration panel.
## Overview
Cost Reports deliver a dashboard, dashboard widget, or Explorer-backed cost view as a formatted snapshot on a schedule you define. Each report includes the cost breakdown, a comparison against a previous period, and a direct link back to Costory.
Where it fits in your day-to-day:
* Sending weekly cost updates to each squad's Slack channel so engineers see their infrastructure spend without logging into a dashboard
* Delivering monthly executive summaries to leadership with pre-filtered views scoped to their business unit
* Keeping SRE and platform teams informed about infrastructure cost trends as part of their existing review cadence
## Get started
You can schedule a report from chat. Ask the [Costory MCP](/features/mcp) to *"send a weekly cost-by-team report to our #finops Slack channel"* and it creates the schedule against the view you describe.
Open the [dashboard](/features/dashboards), dashboard widget, or [Explorer](/features/cost-explorer) query you want to deliver on a schedule.
Open the action menu and select **Schedule Report**. This opens the scheduling
configuration panel.
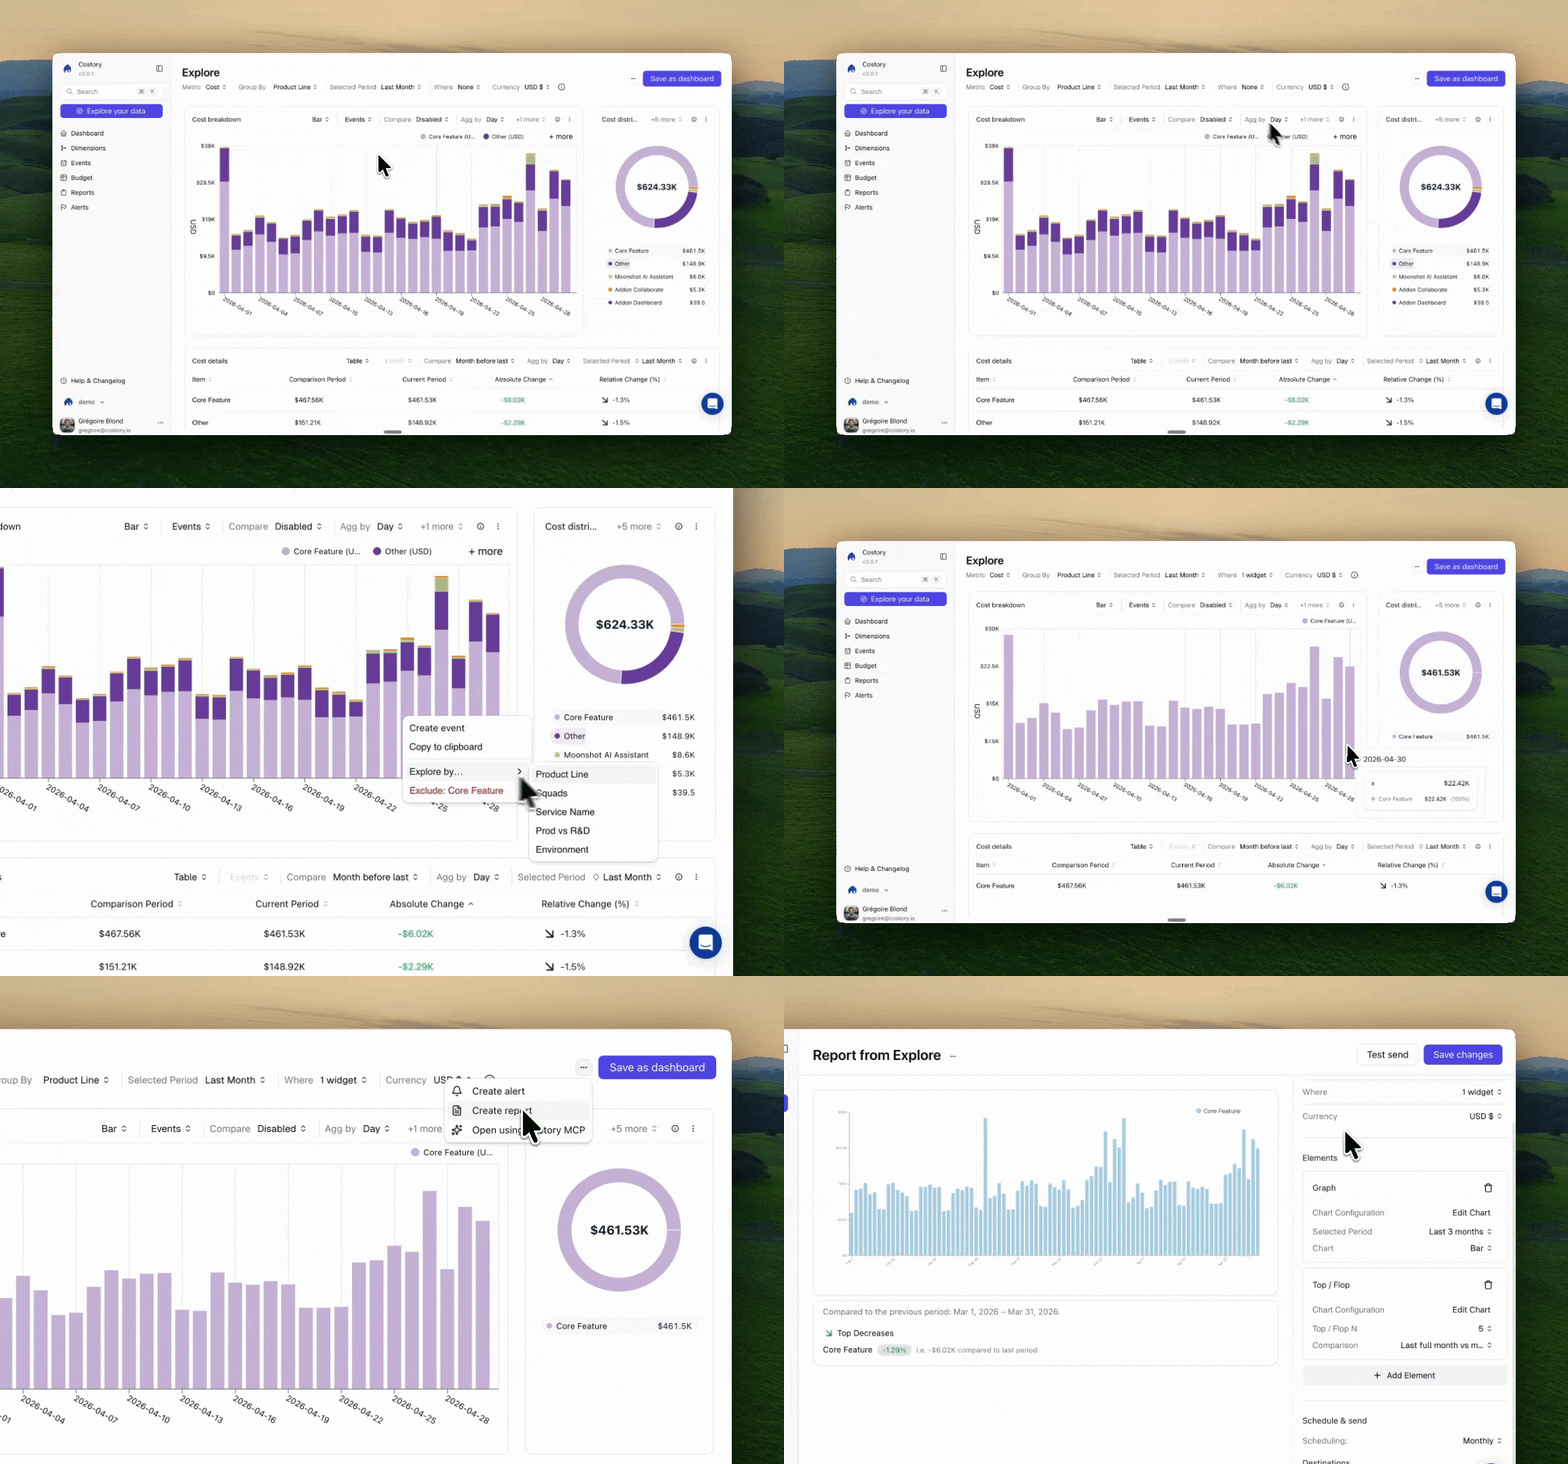 Select where the report should be delivered. Costory supports Slack,
Microsoft Teams, and email.
You can create multiple scheduled reports from the same source view, each
targeting a different channel or cadence.
Before first delivery, complete channel setup for
[Slack](/setup/collaboration/slack), [Microsoft
Teams](/setup/collaboration/teams), or
[Email](/setup/collaboration/email).
Set the delivery schedule and the comparison period for the report.
How often the report is generated and delivered.
The reference period shown alongside the current period, so recipients see
the cost change at a glance.
Review the configuration and click **Save**. You can send a test report
immediately to verify the channel, format, and data before the first
scheduled delivery.
There is no additional cost for scheduling reports. Send as many as you need
across Slack, Teams, and email.
## How a report is built
Every report combines the same building blocks, whether you assemble them in the UI, describe them to the [Costory MCP](/features/mcp), or send them to the [Reports API](/api-reference/reports/overview):
* A **scope**: the accounts, services, tags, or filters the report covers.
* A **group-by**: the dimension the cost is split by, such as service, environment, or vendor.
* One or more **widgets**: the charts rendered in the message.
* A **cadence**: weekly on a set weekday, monthly, or on-demand.
* One or more **destinations**: the Slack, Teams, or email targets it fans out to.
Each widget carries its own Explorer query in `advancedExplorerRequest`: a `period`, and a `queries` array holding the metric, group-by, and chart type to render.
| Widget | What it shows |
| -------------------------- | ----------------------------------------------------------------------- |
| Trend graph | Cost over time as a line, so recipients see direction and relative size |
| Top and bottom | The largest items, and optionally the biggest increases and decreases |
| [Digest](/features/digest) | A breakdown of the change into drivers, with an optional AI narrative |
| Dashboard PDF | A full dashboard rendered as an attached PDF |
| Text | A short markdown note to frame the numbers |
## What you can build
The building blocks above cover a wide range of reports. The examples below show the output, the sentence that creates it through the Costory MCP, and the equivalent [Reports API](/api-reference/reports/create-a-report) call.
| Report | Grouped by | Cadence | Sent to |
| --------------------------------------------------------------- | ------------------------- | ----------------- | ------------------ |
| [Weekly engineering pulse](#weekly-engineering-pulse) | Environment, then service | Weekly | Team Slack channel |
| [Executive environment costs](#executive-environment-costs) | Environment | Monthly | Leadership email |
| [Kubernetes namespace showback](#kubernetes-namespace-showback) | Namespace | Weekly | Platform channel |
| [Marketplace and vendor spend](#marketplace-and-vendor-spend) | Vendor (invoice issuer) | Monthly | Finance channel |
| [Credit and discount runway](#credit-and-discount-runway) | Charge category | Monthly | FinOps channel |
| [Tag coverage](#tag-coverage) | Service | Weekly or monthly | FinOps channel |
Each API example carries a complete widget query in `advancedExplorerRequest`.
Scope filters go in each query's `whereClause`; the examples show the intended
filter as a comment. See [Create a
report](/api-reference/reports/create-a-report) for the full schema, the list
of metrics and date presets, and a live playground.
### Weekly engineering pulse
Give each engineering team a weekly view of what moved. Group by environment, then by service, turn on the Digest AI narrative, and deliver it to the team's channel every Monday. Engineers see which service drove the change and why, without opening a dashboard. See the [Decentralize FinOps guide](/automate-reporting/decentralize-finops) for a full walkthrough.
Select where the report should be delivered. Costory supports Slack,
Microsoft Teams, and email.
You can create multiple scheduled reports from the same source view, each
targeting a different channel or cadence.
Before first delivery, complete channel setup for
[Slack](/setup/collaboration/slack), [Microsoft
Teams](/setup/collaboration/teams), or
[Email](/setup/collaboration/email).
Set the delivery schedule and the comparison period for the report.
How often the report is generated and delivered.
The reference period shown alongside the current period, so recipients see
the cost change at a glance.
Review the configuration and click **Save**. You can send a test report
immediately to verify the channel, format, and data before the first
scheduled delivery.
There is no additional cost for scheduling reports. Send as many as you need
across Slack, Teams, and email.
## How a report is built
Every report combines the same building blocks, whether you assemble them in the UI, describe them to the [Costory MCP](/features/mcp), or send them to the [Reports API](/api-reference/reports/overview):
* A **scope**: the accounts, services, tags, or filters the report covers.
* A **group-by**: the dimension the cost is split by, such as service, environment, or vendor.
* One or more **widgets**: the charts rendered in the message.
* A **cadence**: weekly on a set weekday, monthly, or on-demand.
* One or more **destinations**: the Slack, Teams, or email targets it fans out to.
Each widget carries its own Explorer query in `advancedExplorerRequest`: a `period`, and a `queries` array holding the metric, group-by, and chart type to render.
| Widget | What it shows |
| -------------------------- | ----------------------------------------------------------------------- |
| Trend graph | Cost over time as a line, so recipients see direction and relative size |
| Top and bottom | The largest items, and optionally the biggest increases and decreases |
| [Digest](/features/digest) | A breakdown of the change into drivers, with an optional AI narrative |
| Dashboard PDF | A full dashboard rendered as an attached PDF |
| Text | A short markdown note to frame the numbers |
## What you can build
The building blocks above cover a wide range of reports. The examples below show the output, the sentence that creates it through the Costory MCP, and the equivalent [Reports API](/api-reference/reports/create-a-report) call.
| Report | Grouped by | Cadence | Sent to |
| --------------------------------------------------------------- | ------------------------- | ----------------- | ------------------ |
| [Weekly engineering pulse](#weekly-engineering-pulse) | Environment, then service | Weekly | Team Slack channel |
| [Executive environment costs](#executive-environment-costs) | Environment | Monthly | Leadership email |
| [Kubernetes namespace showback](#kubernetes-namespace-showback) | Namespace | Weekly | Platform channel |
| [Marketplace and vendor spend](#marketplace-and-vendor-spend) | Vendor (invoice issuer) | Monthly | Finance channel |
| [Credit and discount runway](#credit-and-discount-runway) | Charge category | Monthly | FinOps channel |
| [Tag coverage](#tag-coverage) | Service | Weekly or monthly | FinOps channel |
Each API example carries a complete widget query in `advancedExplorerRequest`.
Scope filters go in each query's `whereClause`; the examples show the intended
filter as a comment. See [Create a
report](/api-reference/reports/create-a-report) for the full schema, the list
of metrics and date presets, and a live playground.
### Weekly engineering pulse
Give each engineering team a weekly view of what moved. Group by environment, then by service, turn on the Digest AI narrative, and deliver it to the team's channel every Monday. Engineers see which service drove the change and why, without opening a dashboard. See the [Decentralize FinOps guide](/automate-reporting/decentralize-finops) for a full walkthrough.
 ```text Ask Costory (MCP) theme={null}
Send a weekly report every Monday to #eng-costs, grouped by
environment and then service, with the Digest AI summary turned on.
```
```json API theme={null}
POST /reports
{
"name": "Weekly engineering pulse",
"scheduledPeriod": "WEEKLY",
"scheduledWeekday": 1,
"context": { "groupBy": "env", "datePreset": "LAST_WEEK" },
"widgets": [
{
"type": "DIGEST",
"enableAiInvestigation": true,
"additionalGroupBy": ["cos_service_name"],
"advancedExplorerRequest": {
"period": { "datePreset": "LAST_WEEK", "aggBy": "Week" },
"queries": [
{
"type": "cost",
"metricId": "cost",
"aggregator": "SUM",
"groupBy": "env",
"whereClause": {},
"name": "Cost",
"colorIndex": 0,
"chartType": "TABLE"
}
],
"eventsFilter": {},
"bookmarkedEvents": []
}
}
],
"destinations": [
{ "destinationType": "SLACK", "destinationValue": "C0ENGCOSTS" }
]
}
```
### Executive environment costs
Leadership usually wants one clean number per environment, not a drill-down. Build an environment Virtual Dimension that maps accounts, tags, and cluster labels to prod, staging, and dev, then schedule a monthly ranking of the top environments. Add a twelve-month trend to catch non-production creep, and deliver it to a leadership channel or mailing list. See [Executive Cost Reports](/use-cases/what_your_exec_team_wants/value) for more on building views for stakeholders.
```text Ask Costory (MCP) theme={null}
Send a weekly report every Monday to #eng-costs, grouped by
environment and then service, with the Digest AI summary turned on.
```
```json API theme={null}
POST /reports
{
"name": "Weekly engineering pulse",
"scheduledPeriod": "WEEKLY",
"scheduledWeekday": 1,
"context": { "groupBy": "env", "datePreset": "LAST_WEEK" },
"widgets": [
{
"type": "DIGEST",
"enableAiInvestigation": true,
"additionalGroupBy": ["cos_service_name"],
"advancedExplorerRequest": {
"period": { "datePreset": "LAST_WEEK", "aggBy": "Week" },
"queries": [
{
"type": "cost",
"metricId": "cost",
"aggregator": "SUM",
"groupBy": "env",
"whereClause": {},
"name": "Cost",
"colorIndex": 0,
"chartType": "TABLE"
}
],
"eventsFilter": {},
"bookmarkedEvents": []
}
}
],
"destinations": [
{ "destinationType": "SLACK", "destinationValue": "C0ENGCOSTS" }
]
}
```
### Executive environment costs
Leadership usually wants one clean number per environment, not a drill-down. Build an environment Virtual Dimension that maps accounts, tags, and cluster labels to prod, staging, and dev, then schedule a monthly ranking of the top environments. Add a twelve-month trend to catch non-production creep, and deliver it to a leadership channel or mailing list. See [Executive Cost Reports](/use-cases/what_your_exec_team_wants/value) for more on building views for stakeholders.
 ```text Ask Costory (MCP) theme={null}
Every month, email leadership@acme.com a report of our top
environments by cost, with a twelve-month trend.
```
```json API theme={null}
POST /reports
{
"name": "Environment costs",
"scheduledPeriod": "MONTHLY",
"context": { "groupBy": "env", "datePreset": "LAST_MONTH" },
"widgets": [
{
"type": "TOP_FLOP",
"topN": 10,
"flopN": 0,
"advancedExplorerRequest": {
"period": { "datePreset": "LAST_MONTH", "aggBy": "Period" },
"queries": [
{
"type": "cost",
"metricId": "cost",
"aggregator": "SUM",
"groupBy": "env",
"whereClause": {},
"name": "Cost by environment",
"colorIndex": 0,
"chartType": "BAR"
}
],
"eventsFilter": {},
"bookmarkedEvents": []
}
},
{
"type": "GRAPH_SNAPSHOT",
"advancedExplorerRequest": {
"period": { "datePreset": "LAST_12_MONTHS", "aggBy": "Month" },
"queries": [
{
"type": "cost",
"metricId": "cost",
"aggregator": "SUM",
"groupBy": "env",
"whereClause": {},
"name": "Cost by environment",
"colorIndex": 0,
"chartType": "LINE"
}
],
"eventsFilter": {},
"bookmarkedEvents": []
}
}
],
"destinations": [
{ "destinationType": "EMAIL", "destinationValue": "leadership@acme.com" }
]
}
```
### Kubernetes namespace showback
On shared clusters it is hard to tell which team drives the EKS or GKE bill. Scope a report to reallocated namespace cost, group by namespace, and send a weekly breakdown with a fourteen-week trend and the last week's movers to the platform channel. This gives each team showback on shared infrastructure. A sudden drop is as useful as a spike, since it can mean a broken workload or a real saving.
```text Ask Costory (MCP) theme={null}
Every month, email leadership@acme.com a report of our top
environments by cost, with a twelve-month trend.
```
```json API theme={null}
POST /reports
{
"name": "Environment costs",
"scheduledPeriod": "MONTHLY",
"context": { "groupBy": "env", "datePreset": "LAST_MONTH" },
"widgets": [
{
"type": "TOP_FLOP",
"topN": 10,
"flopN": 0,
"advancedExplorerRequest": {
"period": { "datePreset": "LAST_MONTH", "aggBy": "Period" },
"queries": [
{
"type": "cost",
"metricId": "cost",
"aggregator": "SUM",
"groupBy": "env",
"whereClause": {},
"name": "Cost by environment",
"colorIndex": 0,
"chartType": "BAR"
}
],
"eventsFilter": {},
"bookmarkedEvents": []
}
},
{
"type": "GRAPH_SNAPSHOT",
"advancedExplorerRequest": {
"period": { "datePreset": "LAST_12_MONTHS", "aggBy": "Month" },
"queries": [
{
"type": "cost",
"metricId": "cost",
"aggregator": "SUM",
"groupBy": "env",
"whereClause": {},
"name": "Cost by environment",
"colorIndex": 0,
"chartType": "LINE"
}
],
"eventsFilter": {},
"bookmarkedEvents": []
}
}
],
"destinations": [
{ "destinationType": "EMAIL", "destinationValue": "leadership@acme.com" }
]
}
```
### Kubernetes namespace showback
On shared clusters it is hard to tell which team drives the EKS or GKE bill. Scope a report to reallocated namespace cost, group by namespace, and send a weekly breakdown with a fourteen-week trend and the last week's movers to the platform channel. This gives each team showback on shared infrastructure. A sudden drop is as useful as a spike, since it can mean a broken workload or a real saving.
 ```text Ask Costory (MCP) theme={null}
Send a weekly namespace cost report to #platform every Monday,
with a fourteen-week trend and the top and bottom movers.
```
```jsonc API theme={null}
POST /reports
{
"name": "Namespace showback",
"scheduledPeriod": "WEEKLY",
"scheduledWeekday": 1,
"context": { "groupBy": "cos_namespace_reallocated", "datePreset": "LAST_WEEK" },
"widgets": [
{
"type": "GRAPH_SNAPSHOT",
"advancedExplorerRequest": {
"period": { "datePreset": "TRAILING_14_WEEKS", "aggBy": "Week" },
"queries": [
{
"type": "cost",
"metricId": "cost",
"aggregator": "SUM",
"groupBy": "cos_namespace_reallocated",
"whereClause": {}, // scope: only rows with a reallocated namespace (cos_namespace_reallocated != null)
"name": "Cost by namespace",
"colorIndex": 0,
"chartType": "LINE"
}
],
"eventsFilter": {},
"bookmarkedEvents": []
}
},
{
"type": "TOP_FLOP",
"topN": 10,
"flopN": 10,
"advancedExplorerRequest": {
"period": { "datePreset": "LAST_WEEK", "aggBy": "Period" },
"queries": [
{
"type": "cost",
"metricId": "cost",
"aggregator": "SUM",
"groupBy": "cos_namespace_reallocated",
"whereClause": {}, // scope: only rows with a reallocated namespace (cos_namespace_reallocated != null)
"name": "Cost by namespace",
"colorIndex": 0,
"chartType": "BAR"
}
],
"eventsFilter": {},
"bookmarkedEvents": []
}
}
],
"destinations": [
{ "destinationType": "SLACK", "destinationValue": "C0PLATFORM" }
]
}
```
### Marketplace and vendor spend
Finance often needs to reconcile third-party software billed through the cloud invoice against purchase orders and renewals. Scope a report to marketplace purchases, group by vendor (the invoice issuer), and deliver a monthly ranking with a twelve-month trend to the finance or procurement channel. Native usage such as compute never enters the chart, so the vendor list stays clean.
```text Ask Costory (MCP) theme={null}
Send a weekly namespace cost report to #platform every Monday,
with a fourteen-week trend and the top and bottom movers.
```
```jsonc API theme={null}
POST /reports
{
"name": "Namespace showback",
"scheduledPeriod": "WEEKLY",
"scheduledWeekday": 1,
"context": { "groupBy": "cos_namespace_reallocated", "datePreset": "LAST_WEEK" },
"widgets": [
{
"type": "GRAPH_SNAPSHOT",
"advancedExplorerRequest": {
"period": { "datePreset": "TRAILING_14_WEEKS", "aggBy": "Week" },
"queries": [
{
"type": "cost",
"metricId": "cost",
"aggregator": "SUM",
"groupBy": "cos_namespace_reallocated",
"whereClause": {}, // scope: only rows with a reallocated namespace (cos_namespace_reallocated != null)
"name": "Cost by namespace",
"colorIndex": 0,
"chartType": "LINE"
}
],
"eventsFilter": {},
"bookmarkedEvents": []
}
},
{
"type": "TOP_FLOP",
"topN": 10,
"flopN": 10,
"advancedExplorerRequest": {
"period": { "datePreset": "LAST_WEEK", "aggBy": "Period" },
"queries": [
{
"type": "cost",
"metricId": "cost",
"aggregator": "SUM",
"groupBy": "cos_namespace_reallocated",
"whereClause": {}, // scope: only rows with a reallocated namespace (cos_namespace_reallocated != null)
"name": "Cost by namespace",
"colorIndex": 0,
"chartType": "BAR"
}
],
"eventsFilter": {},
"bookmarkedEvents": []
}
}
],
"destinations": [
{ "destinationType": "SLACK", "destinationValue": "C0PLATFORM" }
]
}
```
### Marketplace and vendor spend
Finance often needs to reconcile third-party software billed through the cloud invoice against purchase orders and renewals. Scope a report to marketplace purchases, group by vendor (the invoice issuer), and deliver a monthly ranking with a twelve-month trend to the finance or procurement channel. Native usage such as compute never enters the chart, so the vendor list stays clean.
 ```text Ask Costory (MCP) theme={null}
Each month, send a marketplace-only report grouped by vendor
to #finance, with a twelve-month trend.
```
```jsonc API theme={null}
POST /reports
{
"name": "Marketplace spend by vendor",
"scheduledPeriod": "MONTHLY",
"context": { "groupBy": "cos_invoice_issuer", "datePreset": "LAST_MONTH" },
"widgets": [
{
"type": "GRAPH_SNAPSHOT",
"advancedExplorerRequest": {
"period": { "datePreset": "LAST_12_MONTHS", "aggBy": "Month" },
"queries": [
{
"type": "cost",
"metricId": "cost",
"aggregator": "SUM",
"groupBy": "cos_invoice_issuer",
"whereClause": {}, // scope: marketplace purchases only (cos_marketplace_purchase == true)
"name": "Marketplace cost by vendor",
"colorIndex": 0,
"chartType": "LINE"
}
],
"eventsFilter": {},
"bookmarkedEvents": []
}
},
{
"type": "TOP_FLOP",
"topN": 10,
"flopN": 0,
"advancedExplorerRequest": {
"period": { "datePreset": "LAST_MONTH", "aggBy": "Period" },
"queries": [
{
"type": "cost",
"metricId": "cost",
"aggregator": "SUM",
"groupBy": "cos_invoice_issuer",
"whereClause": {}, // scope: marketplace purchases only (cos_marketplace_purchase == true)
"name": "Marketplace cost by vendor",
"colorIndex": 0,
"chartType": "BAR"
}
],
"eventsFilter": {},
"bookmarkedEvents": []
}
}
],
"destinations": [
{ "destinationType": "SLACK", "destinationValue": "C0FINANCE" }
]
}
```
### Credit and discount runway
Committed-use discounts, savings plans, and promotional credits all settle on the monthly invoice, and a shrinking credit line is easy to miss until it is gone. Group a report by charge category to separate usage from credits, discounts, and refunds, and schedule it monthly. The last-month movers surface a credit that is running out before the real invoice arrives.
```text Ask Costory (MCP) theme={null}
Each month, send a marketplace-only report grouped by vendor
to #finance, with a twelve-month trend.
```
```jsonc API theme={null}
POST /reports
{
"name": "Marketplace spend by vendor",
"scheduledPeriod": "MONTHLY",
"context": { "groupBy": "cos_invoice_issuer", "datePreset": "LAST_MONTH" },
"widgets": [
{
"type": "GRAPH_SNAPSHOT",
"advancedExplorerRequest": {
"period": { "datePreset": "LAST_12_MONTHS", "aggBy": "Month" },
"queries": [
{
"type": "cost",
"metricId": "cost",
"aggregator": "SUM",
"groupBy": "cos_invoice_issuer",
"whereClause": {}, // scope: marketplace purchases only (cos_marketplace_purchase == true)
"name": "Marketplace cost by vendor",
"colorIndex": 0,
"chartType": "LINE"
}
],
"eventsFilter": {},
"bookmarkedEvents": []
}
},
{
"type": "TOP_FLOP",
"topN": 10,
"flopN": 0,
"advancedExplorerRequest": {
"period": { "datePreset": "LAST_MONTH", "aggBy": "Period" },
"queries": [
{
"type": "cost",
"metricId": "cost",
"aggregator": "SUM",
"groupBy": "cos_invoice_issuer",
"whereClause": {}, // scope: marketplace purchases only (cos_marketplace_purchase == true)
"name": "Marketplace cost by vendor",
"colorIndex": 0,
"chartType": "BAR"
}
],
"eventsFilter": {},
"bookmarkedEvents": []
}
}
],
"destinations": [
{ "destinationType": "SLACK", "destinationValue": "C0FINANCE" }
]
}
```
### Credit and discount runway
Committed-use discounts, savings plans, and promotional credits all settle on the monthly invoice, and a shrinking credit line is easy to miss until it is gone. Group a report by charge category to separate usage from credits, discounts, and refunds, and schedule it monthly. The last-month movers surface a credit that is running out before the real invoice arrives.
 ```text Ask Costory (MCP) theme={null}
Send a monthly report grouped by charge category to #finops so
we can watch our credits and discounts.
```
```json API theme={null}
POST /reports
{
"name": "Credit and discount runway",
"scheduledPeriod": "MONTHLY",
"context": { "groupBy": "cos_charge_category", "datePreset": "LAST_MONTH" },
"widgets": [
{
"type": "GRAPH_SNAPSHOT",
"advancedExplorerRequest": {
"period": { "datePreset": "LAST_12_MONTHS", "aggBy": "Month" },
"queries": [
{
"type": "cost",
"metricId": "cost",
"aggregator": "SUM",
"groupBy": "cos_charge_category",
"whereClause": {},
"name": "Cost by charge category",
"colorIndex": 0,
"chartType": "LINE"
}
],
"eventsFilter": {},
"bookmarkedEvents": []
}
},
{
"type": "TOP_FLOP",
"topN": 10,
"flopN": 10,
"advancedExplorerRequest": {
"period": { "datePreset": "LAST_MONTH", "aggBy": "Period" },
"queries": [
{
"type": "cost",
"metricId": "cost",
"aggregator": "SUM",
"groupBy": "cos_charge_category",
"whereClause": {},
"name": "Cost by charge category",
"colorIndex": 0,
"chartType": "BAR"
}
],
"eventsFilter": {},
"bookmarkedEvents": []
}
}
],
"destinations": [
{ "destinationType": "SLACK", "destinationValue": "C0FINOPS" }
]
}
```
### Tag coverage
When half the bill cannot be allocated, a tagging campaign needs a number the team can move. Track the share of in-scope cost that carries the required tag, grouped by service so the gaps point at an owner. The coverage ratio is a formula over two cost queries: tagged cost divided by all in-scope cost. Schedule it weekly during an active cleanup, then drop to monthly once coverage holds.
```text Ask Costory (MCP) theme={null}
Send a monthly report grouped by charge category to #finops so
we can watch our credits and discounts.
```
```json API theme={null}
POST /reports
{
"name": "Credit and discount runway",
"scheduledPeriod": "MONTHLY",
"context": { "groupBy": "cos_charge_category", "datePreset": "LAST_MONTH" },
"widgets": [
{
"type": "GRAPH_SNAPSHOT",
"advancedExplorerRequest": {
"period": { "datePreset": "LAST_12_MONTHS", "aggBy": "Month" },
"queries": [
{
"type": "cost",
"metricId": "cost",
"aggregator": "SUM",
"groupBy": "cos_charge_category",
"whereClause": {},
"name": "Cost by charge category",
"colorIndex": 0,
"chartType": "LINE"
}
],
"eventsFilter": {},
"bookmarkedEvents": []
}
},
{
"type": "TOP_FLOP",
"topN": 10,
"flopN": 10,
"advancedExplorerRequest": {
"period": { "datePreset": "LAST_MONTH", "aggBy": "Period" },
"queries": [
{
"type": "cost",
"metricId": "cost",
"aggregator": "SUM",
"groupBy": "cos_charge_category",
"whereClause": {},
"name": "Cost by charge category",
"colorIndex": 0,
"chartType": "BAR"
}
],
"eventsFilter": {},
"bookmarkedEvents": []
}
}
],
"destinations": [
{ "destinationType": "SLACK", "destinationValue": "C0FINOPS" }
]
}
```
### Tag coverage
When half the bill cannot be allocated, a tagging campaign needs a number the team can move. Track the share of in-scope cost that carries the required tag, grouped by service so the gaps point at an owner. The coverage ratio is a formula over two cost queries: tagged cost divided by all in-scope cost. Schedule it weekly during an active cleanup, then drop to monthly once coverage holds.
 ```text Ask Costory (MCP) theme={null}
Send a weekly report to #finops showing the share of cost tagged
with team, broken down by service, and the services with the most
untagged spend.
```
```jsonc API theme={null}
POST /reports
{
"name": "Tag coverage",
"scheduledPeriod": "WEEKLY",
"scheduledWeekday": 1,
"context": { "groupBy": "cos_service_name", "datePreset": "LAST_MONTH" },
"widgets": [
{
"type": "GRAPH_SNAPSHOT",
"advancedExplorerRequest": {
"period": { "datePreset": "TRAILING_14_WEEKS", "aggBy": "Week" },
"queries": [
{
"type": "cost",
"alias": "a",
"metricId": "cost",
"aggregator": "SUM",
"groupBy": "cos_service_name",
"whereClause": {}, // scope: rows carrying the required tag (team != null)
"visible": false,
"name": "Tagged cost",
"colorIndex": 0,
"chartType": "LINE"
},
{
"type": "cost",
"alias": "b",
"metricId": "cost",
"aggregator": "SUM",
"groupBy": "cos_service_name",
"whereClause": {},
"visible": false,
"name": "All cost",
"colorIndex": 1,
"chartType": "LINE"
},
{
"type": "formula",
"formula": "a / b",
"name": "Tag coverage",
"colorIndex": 2,
"chartType": "LINE"
}
],
"eventsFilter": {},
"bookmarkedEvents": []
}
}
],
"destinations": [
{ "destinationType": "SLACK", "destinationValue": "C0FINOPS" }
]
}
```
### Explain a cost change on demand
Not every report is recurring. Before a finance review, you often need to explain a single number that moved. Send an on-demand report with a Digest widget that decomposes the change into drivers, for example compute in production up and a new database service added. Set the cadence to none and trigger it once with [Run a report now](/api-reference/reports/run-a-report-now).
```text Ask Costory (MCP) theme={null}
Explain why our bill went up last month, broken down by service,
and post it to #finance once.
```
```json API theme={null}
POST /reports
{
"name": "Why did the bill move?",
"scheduledPeriod": null,
"context": { "groupBy": "cos_service_name", "datePreset": "LAST_MONTH" },
"widgets": [
{
"type": "DIGEST",
"enableAiInvestigation": true,
"advancedExplorerRequest": {
"period": { "datePreset": "LAST_MONTH", "aggBy": "Period" },
"queries": [
{
"type": "cost",
"metricId": "cost",
"aggregator": "SUM",
"groupBy": "cos_service_name",
"whereClause": {},
"name": "Cost by service",
"colorIndex": 0,
"chartType": "TABLE"
}
],
"eventsFilter": {},
"bookmarkedEvents": []
}
}
],
"destinations": [
{ "destinationType": "SLACK", "destinationValue": "C0FINANCE" }
]
}
```
## Build reports with the API
Everything above is available over HTTP through the [Reports API](/api-reference/reports/overview). Authenticate with a bearer token as described in the [API overview](/api-reference/overview), then [create a report](/api-reference/reports/create-a-report) in a single call, [preview a widget](/api-reference/reports/preview-a-report-widget) before scheduling, or [run one now](/api-reference/reports/run-a-report-now). The Costory MCP and the UI both call the same endpoints, so a report built in chat can be edited by hand later, and the other way around.
The reports endpoints are currently a **staging preview** on
`https://app-staging-api.costory.io` and are not yet on the production API.
Point integrations at staging until they ship to production.
## Frequently Asked Questions
Costory supports Slack, Microsoft Teams, and email. You can send the same
report to multiple channels by creating separate schedules from the same
source view.
Yes. Each scheduled report is tied to a specific dashboard, widget, or Explorer context. You can create as
many source views as you need and schedule each one to a different channel with its own cadence.
Reports can be sent weekly or monthly. The cadence is configured per
schedule, so one source view can have a weekly report going to the engineering
channel and a monthly report going to leadership.
Yes. Ask the [Costory MCP](/features/mcp) in plain language, or call the
[Reports API](/api-reference/reports/overview) directly. Both resolve to the
same `POST /reports` call, so a report you start in chat can be edited in the
UI or updated over the API.
Cost Reports deliver a snapshot of a dashboard, widget, or [Explorer](/features/cost-explorer) context on a recurring schedule.
[Digest](/features/digest) is broader: it automatically analyzes your entire
cost structure, ranks changes by dollar impact, and generates AI
explanations for each change. Many teams use both, Cost Reports for ongoing
team-level visibility and Digest for monthly cost reviews and anomaly
triage.
No. Scheduled reports are included at no additional cost, and there is no
cap on the number of active schedules.
## Next Steps
Create, schedule, and run reports over HTTP
Build persistent cost dashboards with multiple widgets
Build the query context behind a report
Auto-triage cost anomalies with AI-generated incident reports
Give each squad ownership of their cloud costs
Define per-team budgets and automate alerts when teams exceed targets
Build the dashboards your leadership team wants to see
```text Ask Costory (MCP) theme={null}
Send a weekly report to #finops showing the share of cost tagged
with team, broken down by service, and the services with the most
untagged spend.
```
```jsonc API theme={null}
POST /reports
{
"name": "Tag coverage",
"scheduledPeriod": "WEEKLY",
"scheduledWeekday": 1,
"context": { "groupBy": "cos_service_name", "datePreset": "LAST_MONTH" },
"widgets": [
{
"type": "GRAPH_SNAPSHOT",
"advancedExplorerRequest": {
"period": { "datePreset": "TRAILING_14_WEEKS", "aggBy": "Week" },
"queries": [
{
"type": "cost",
"alias": "a",
"metricId": "cost",
"aggregator": "SUM",
"groupBy": "cos_service_name",
"whereClause": {}, // scope: rows carrying the required tag (team != null)
"visible": false,
"name": "Tagged cost",
"colorIndex": 0,
"chartType": "LINE"
},
{
"type": "cost",
"alias": "b",
"metricId": "cost",
"aggregator": "SUM",
"groupBy": "cos_service_name",
"whereClause": {},
"visible": false,
"name": "All cost",
"colorIndex": 1,
"chartType": "LINE"
},
{
"type": "formula",
"formula": "a / b",
"name": "Tag coverage",
"colorIndex": 2,
"chartType": "LINE"
}
],
"eventsFilter": {},
"bookmarkedEvents": []
}
}
],
"destinations": [
{ "destinationType": "SLACK", "destinationValue": "C0FINOPS" }
]
}
```
### Explain a cost change on demand
Not every report is recurring. Before a finance review, you often need to explain a single number that moved. Send an on-demand report with a Digest widget that decomposes the change into drivers, for example compute in production up and a new database service added. Set the cadence to none and trigger it once with [Run a report now](/api-reference/reports/run-a-report-now).
```text Ask Costory (MCP) theme={null}
Explain why our bill went up last month, broken down by service,
and post it to #finance once.
```
```json API theme={null}
POST /reports
{
"name": "Why did the bill move?",
"scheduledPeriod": null,
"context": { "groupBy": "cos_service_name", "datePreset": "LAST_MONTH" },
"widgets": [
{
"type": "DIGEST",
"enableAiInvestigation": true,
"advancedExplorerRequest": {
"period": { "datePreset": "LAST_MONTH", "aggBy": "Period" },
"queries": [
{
"type": "cost",
"metricId": "cost",
"aggregator": "SUM",
"groupBy": "cos_service_name",
"whereClause": {},
"name": "Cost by service",
"colorIndex": 0,
"chartType": "TABLE"
}
],
"eventsFilter": {},
"bookmarkedEvents": []
}
}
],
"destinations": [
{ "destinationType": "SLACK", "destinationValue": "C0FINANCE" }
]
}
```
## Build reports with the API
Everything above is available over HTTP through the [Reports API](/api-reference/reports/overview). Authenticate with a bearer token as described in the [API overview](/api-reference/overview), then [create a report](/api-reference/reports/create-a-report) in a single call, [preview a widget](/api-reference/reports/preview-a-report-widget) before scheduling, or [run one now](/api-reference/reports/run-a-report-now). The Costory MCP and the UI both call the same endpoints, so a report built in chat can be edited by hand later, and the other way around.
The reports endpoints are currently a **staging preview** on
`https://app-staging-api.costory.io` and are not yet on the production API.
Point integrations at staging until they ship to production.
## Frequently Asked Questions
Costory supports Slack, Microsoft Teams, and email. You can send the same
report to multiple channels by creating separate schedules from the same
source view.
Yes. Each scheduled report is tied to a specific dashboard, widget, or Explorer context. You can create as
many source views as you need and schedule each one to a different channel with its own cadence.
Reports can be sent weekly or monthly. The cadence is configured per
schedule, so one source view can have a weekly report going to the engineering
channel and a monthly report going to leadership.
Yes. Ask the [Costory MCP](/features/mcp) in plain language, or call the
[Reports API](/api-reference/reports/overview) directly. Both resolve to the
same `POST /reports` call, so a report you start in chat can be edited in the
UI or updated over the API.
Cost Reports deliver a snapshot of a dashboard, widget, or [Explorer](/features/cost-explorer) context on a recurring schedule.
[Digest](/features/digest) is broader: it automatically analyzes your entire
cost structure, ranks changes by dollar impact, and generates AI
explanations for each change. Many teams use both, Cost Reports for ongoing
team-level visibility and Digest for monthly cost reviews and anomaly
triage.
No. Scheduled reports are included at no additional cost, and there is no
cap on the number of active schedules.
## Next Steps
Create, schedule, and run reports over HTTP
Build persistent cost dashboards with multiple widgets
Build the query context behind a report
Auto-triage cost anomalies with AI-generated incident reports
Give each squad ownership of their cloud costs
Define per-team budgets and automate alerts when teams exceed targets
Build the dashboards your leadership team wants to see