June 20 2026
Organize dashboards with tags
You can now add tags to dashboards and bulk edit them from the View all dashboards page, making it easier to group dashboards by team, workflow, or FinOps process.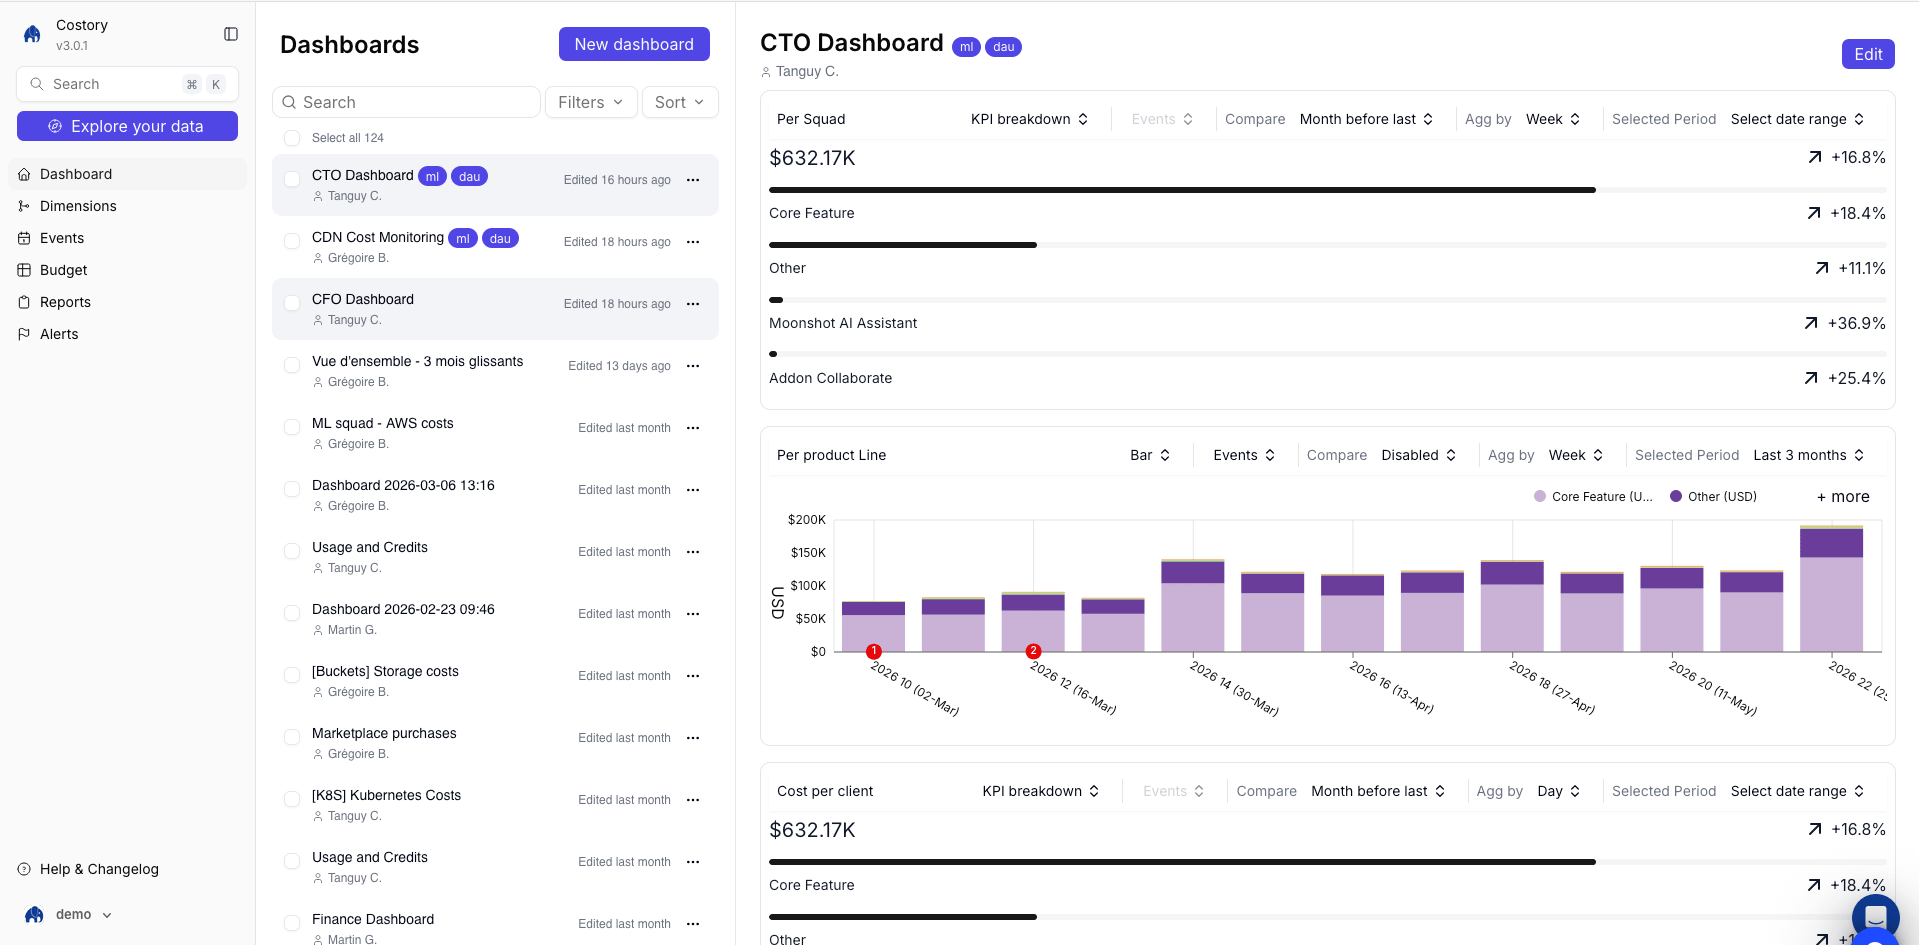
Customize chart color palettes
You can now choose the color palette for each chart from four options, so dashboard visuals stay readable and consistent with the story you want to tell.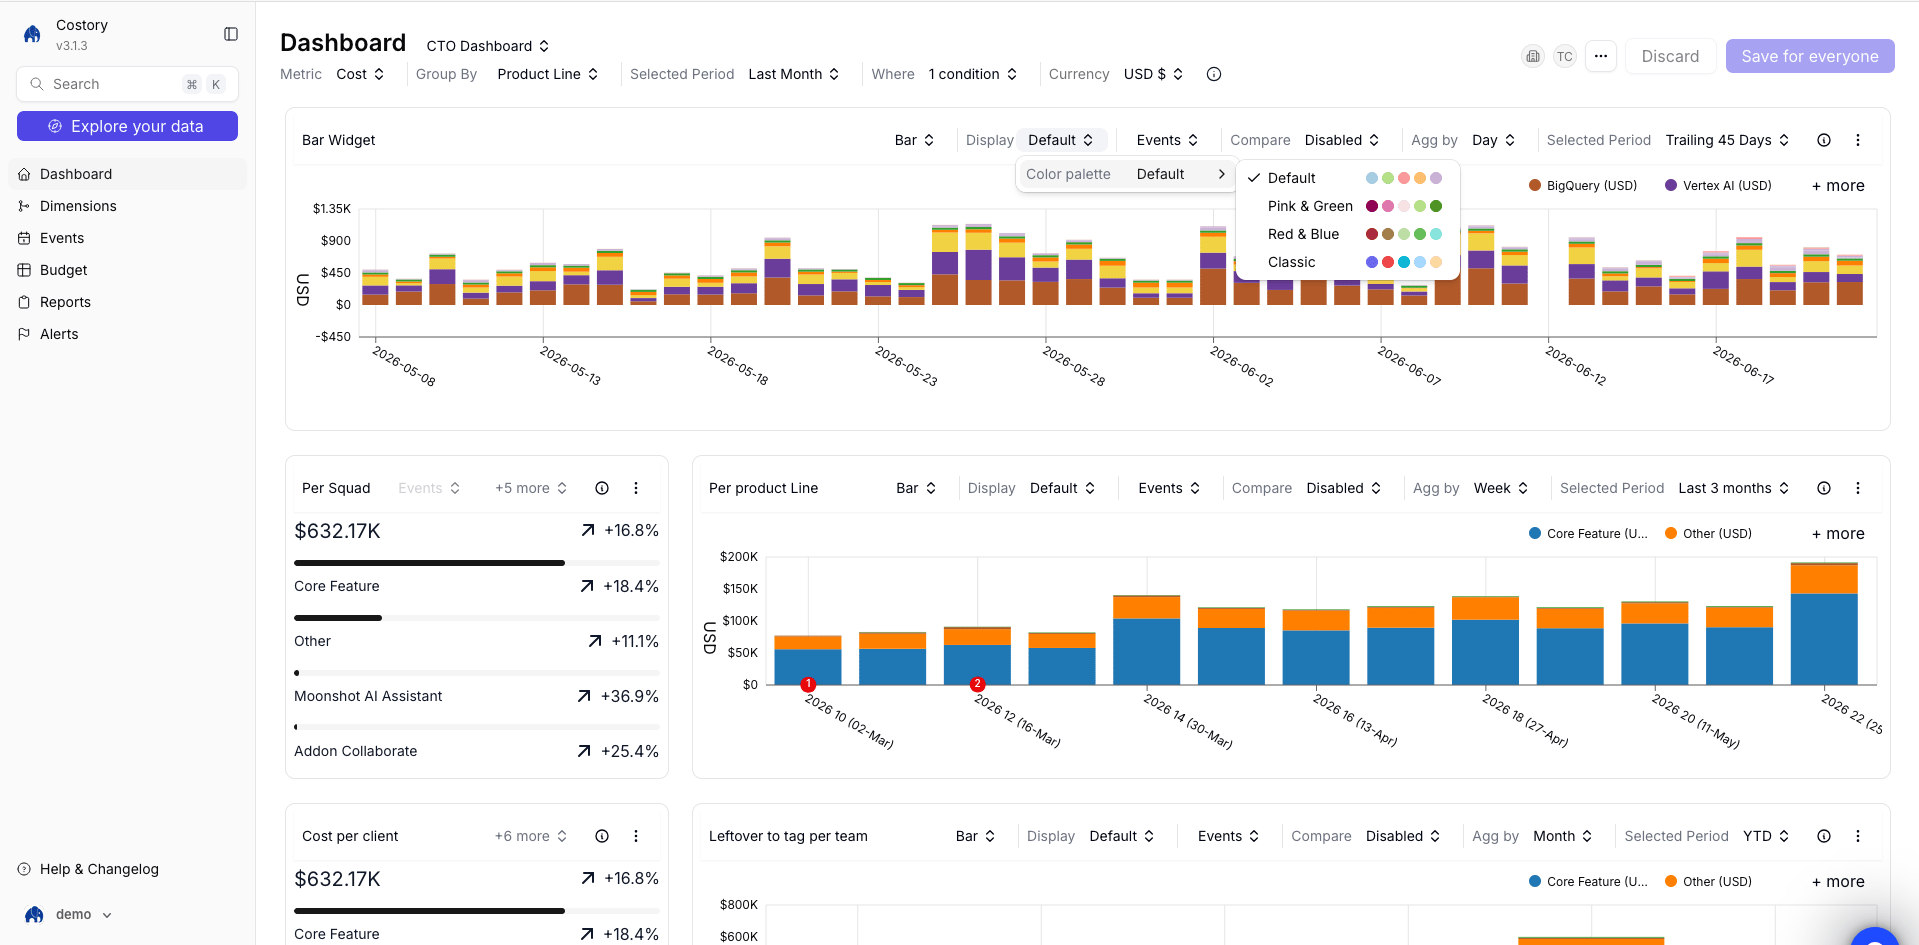
June 1 2026
BigQuery data exports (Copilot Pro)
Query the same cost data you see in Costory from your own BigQuery project—use it in Looker, notebooks, or custom SQL without re-building filters by hand.On any dashboard widget, click Copy SQL query to copy the SQL for that view. An Organization Admin must grant your service account or user read access to the export table under Integrations > Destinations.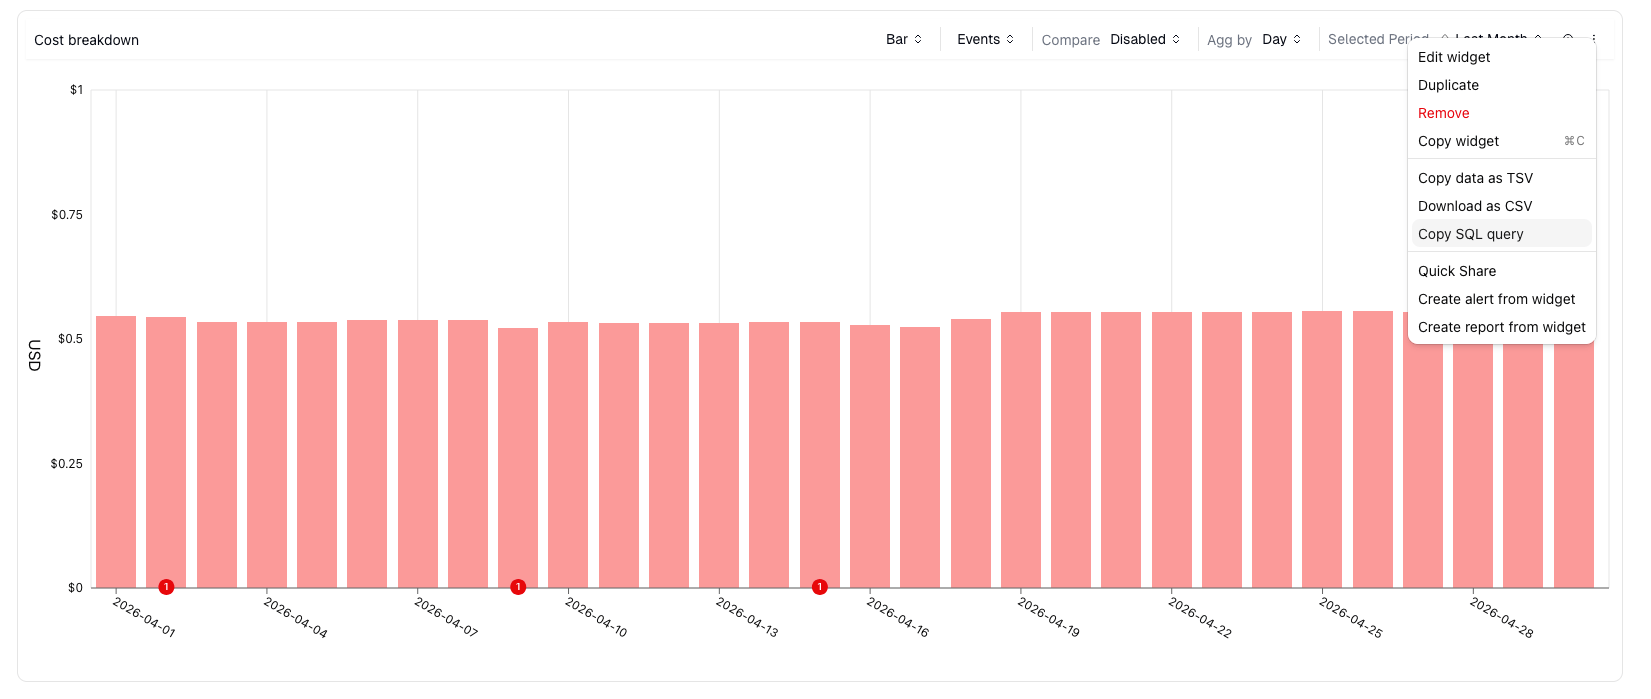
May 19 2026
Costory v3: a simpler way to investigate cloud costs
Two years ago, we built Costory to help you understand and manage cloud costs. Since then, we’ve spoken with many of you about how you use the platform every day.One theme came up often: the product had accumulated too many ways to do the same things.At the same time, LLMs are changing how teams work with their tools. Costory v3 is designed to help you move faster: investigate cost changes, capture context, and turn those investigations into reusable workflows through MCP, APIs, reports, and alerts.So we rebuilt the Costory experience around six core areas you rely on most.- Explorer: Your entrypoint for investigating cost changes.
- Dashboards: Save investigations, revisit them later, and annotate them with events.
- Dimensions: Standardize and group cost labels so every team can understand its costs.
- Events: Add context to cost changes and connect events directly to your analysis.
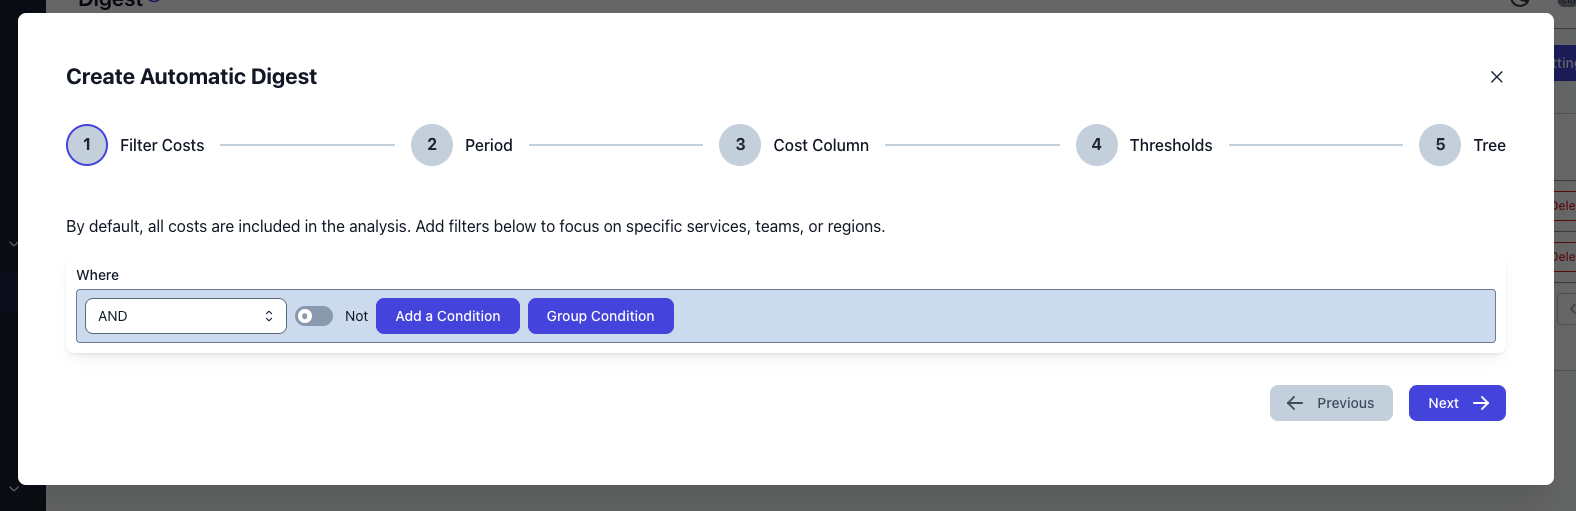
- Reports: Manage scheduled reports, scheduled dashboards, and cost digest analysis in one place. (Cost digests are coming later this month).
- Alerts: Catch unexpected cost increases using fixed thresholds and relative thresholds.
May 6 2026
Snowflake billing
We now support Snowflake account usage and billing data in Costory. Create a Snowflake integration on Integrations with key-pair authentication, then add a Snowflake billing datasource that reuses that integration. Terraform is not available for this datasource yet (connect via the Costory UI).See the Snowflake billing setup guide.April 10 2026
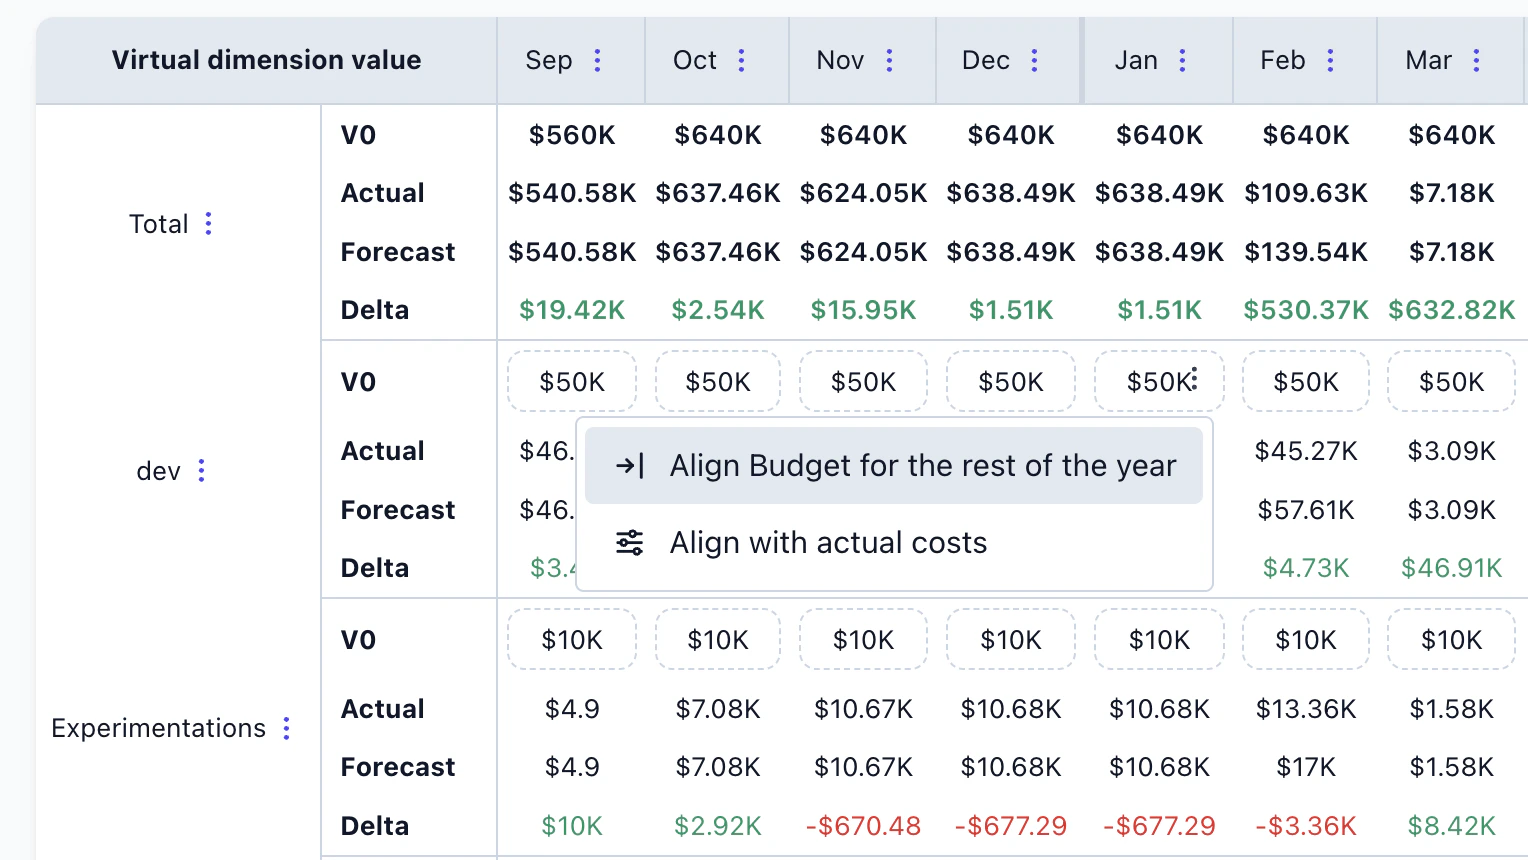
Plot Budgets Alongside Actual Cost in the Explorer
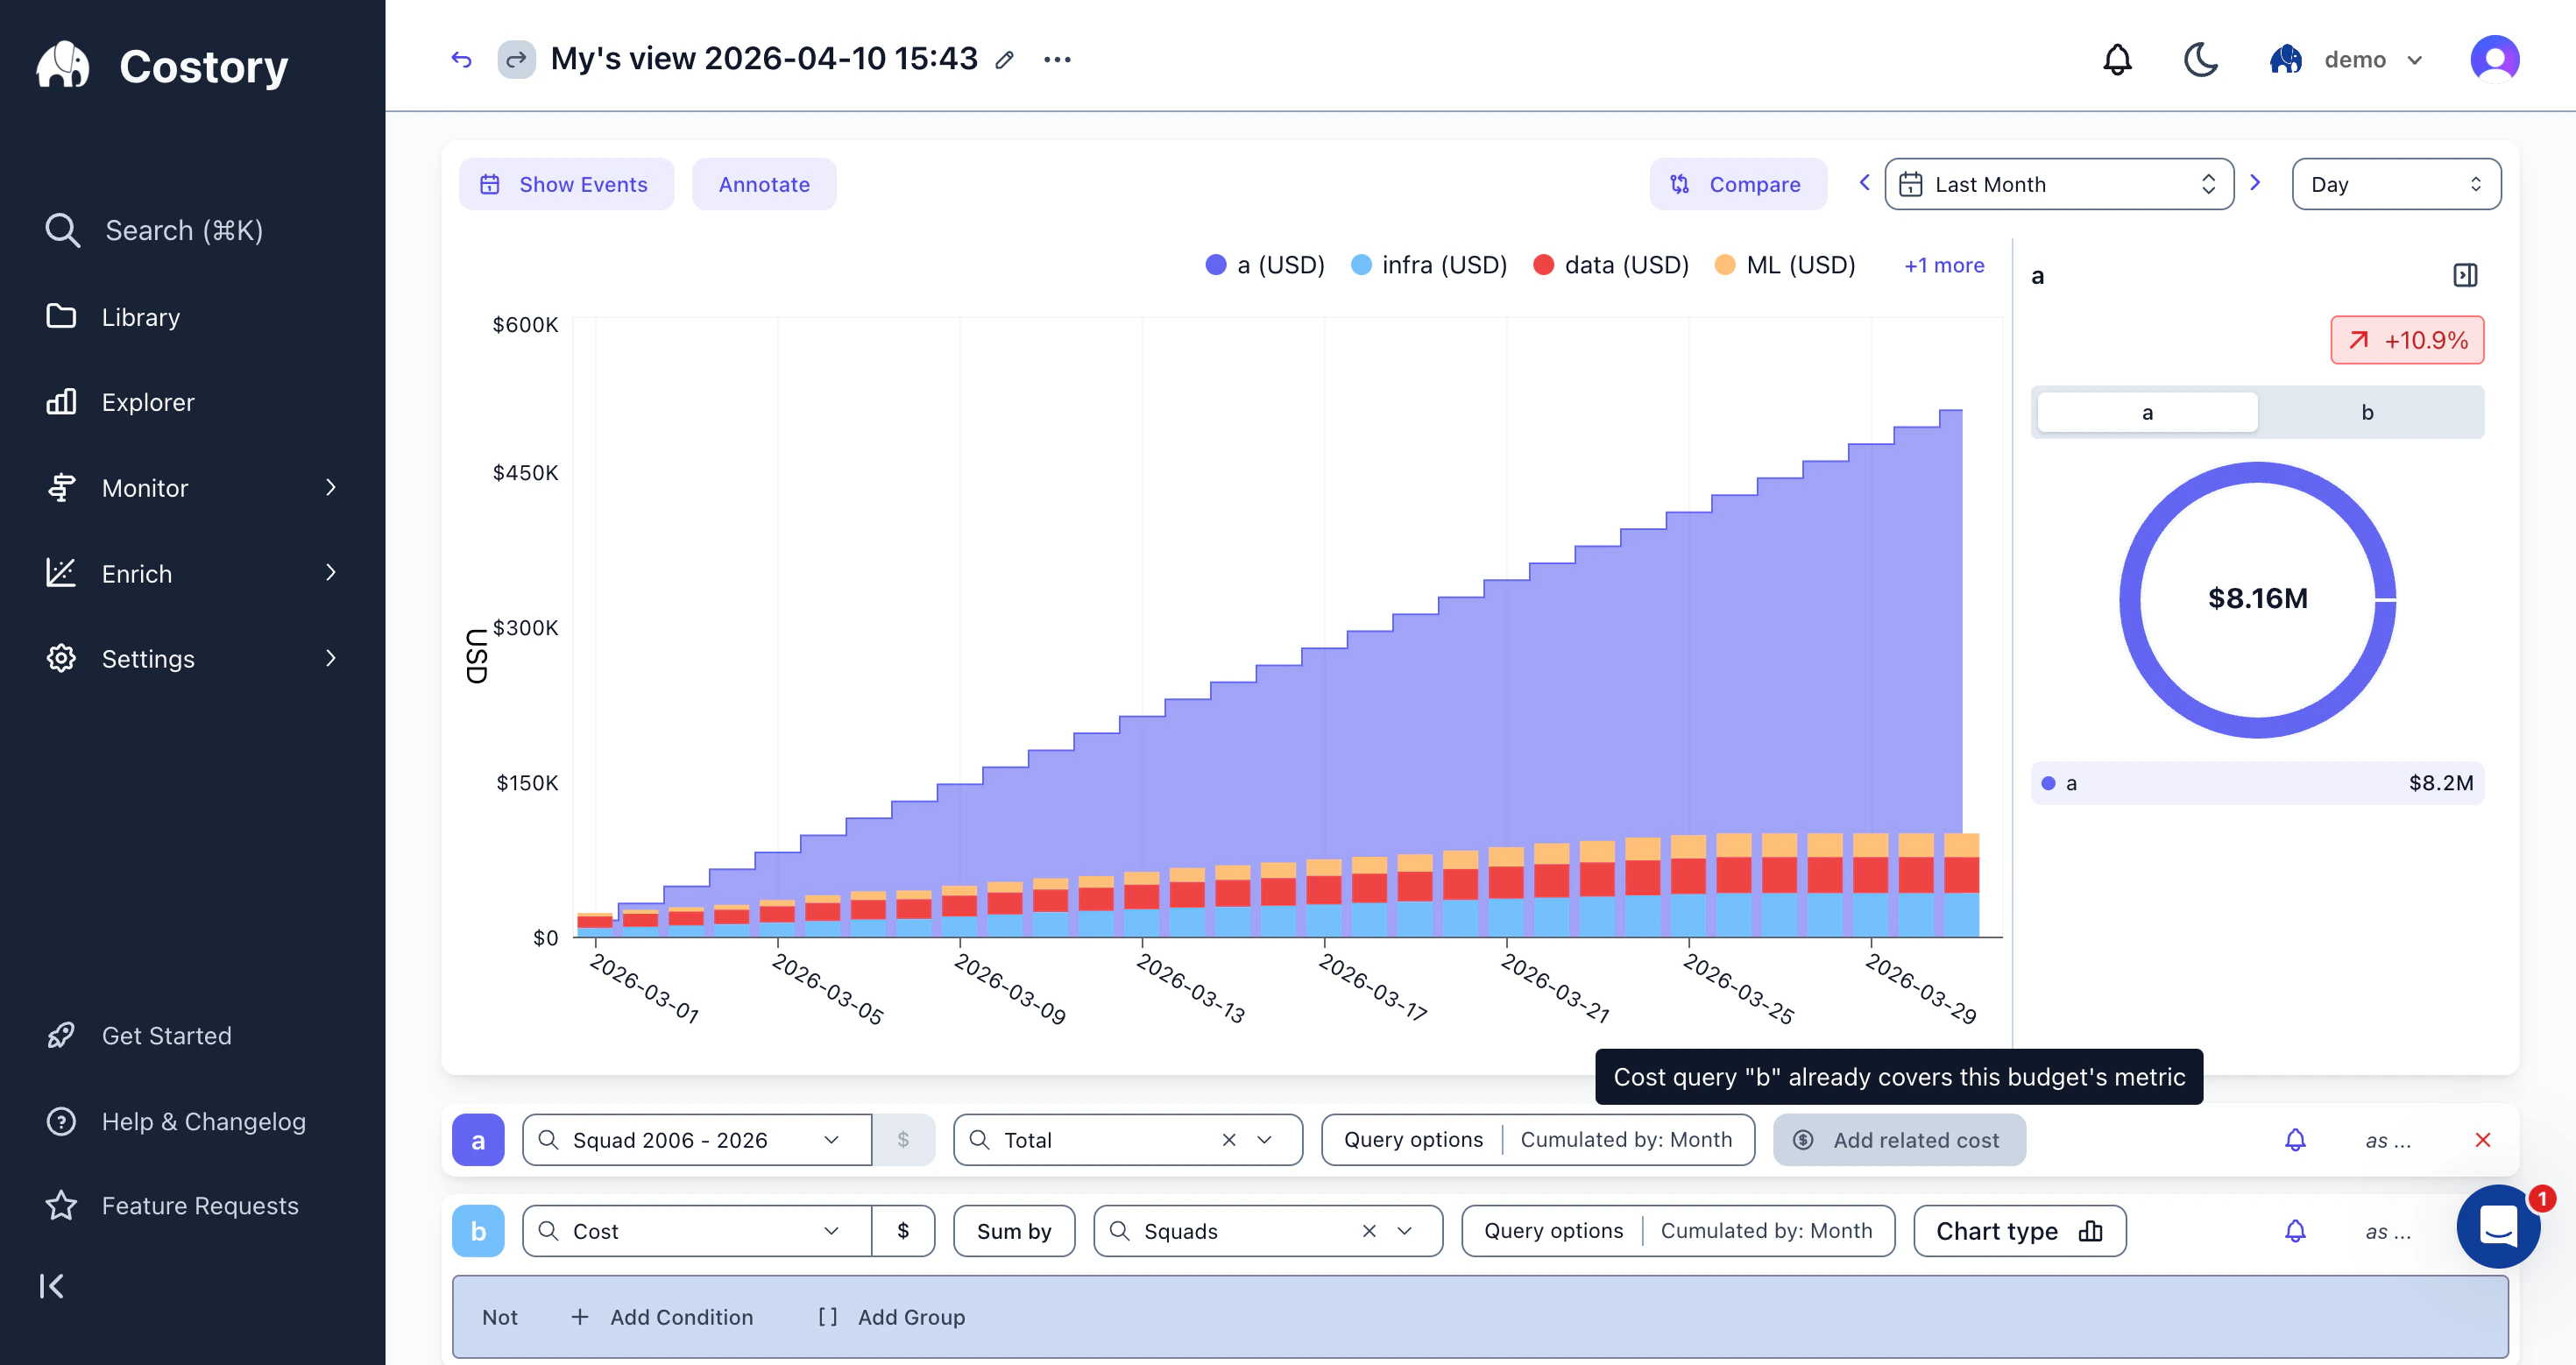
April 10 2026
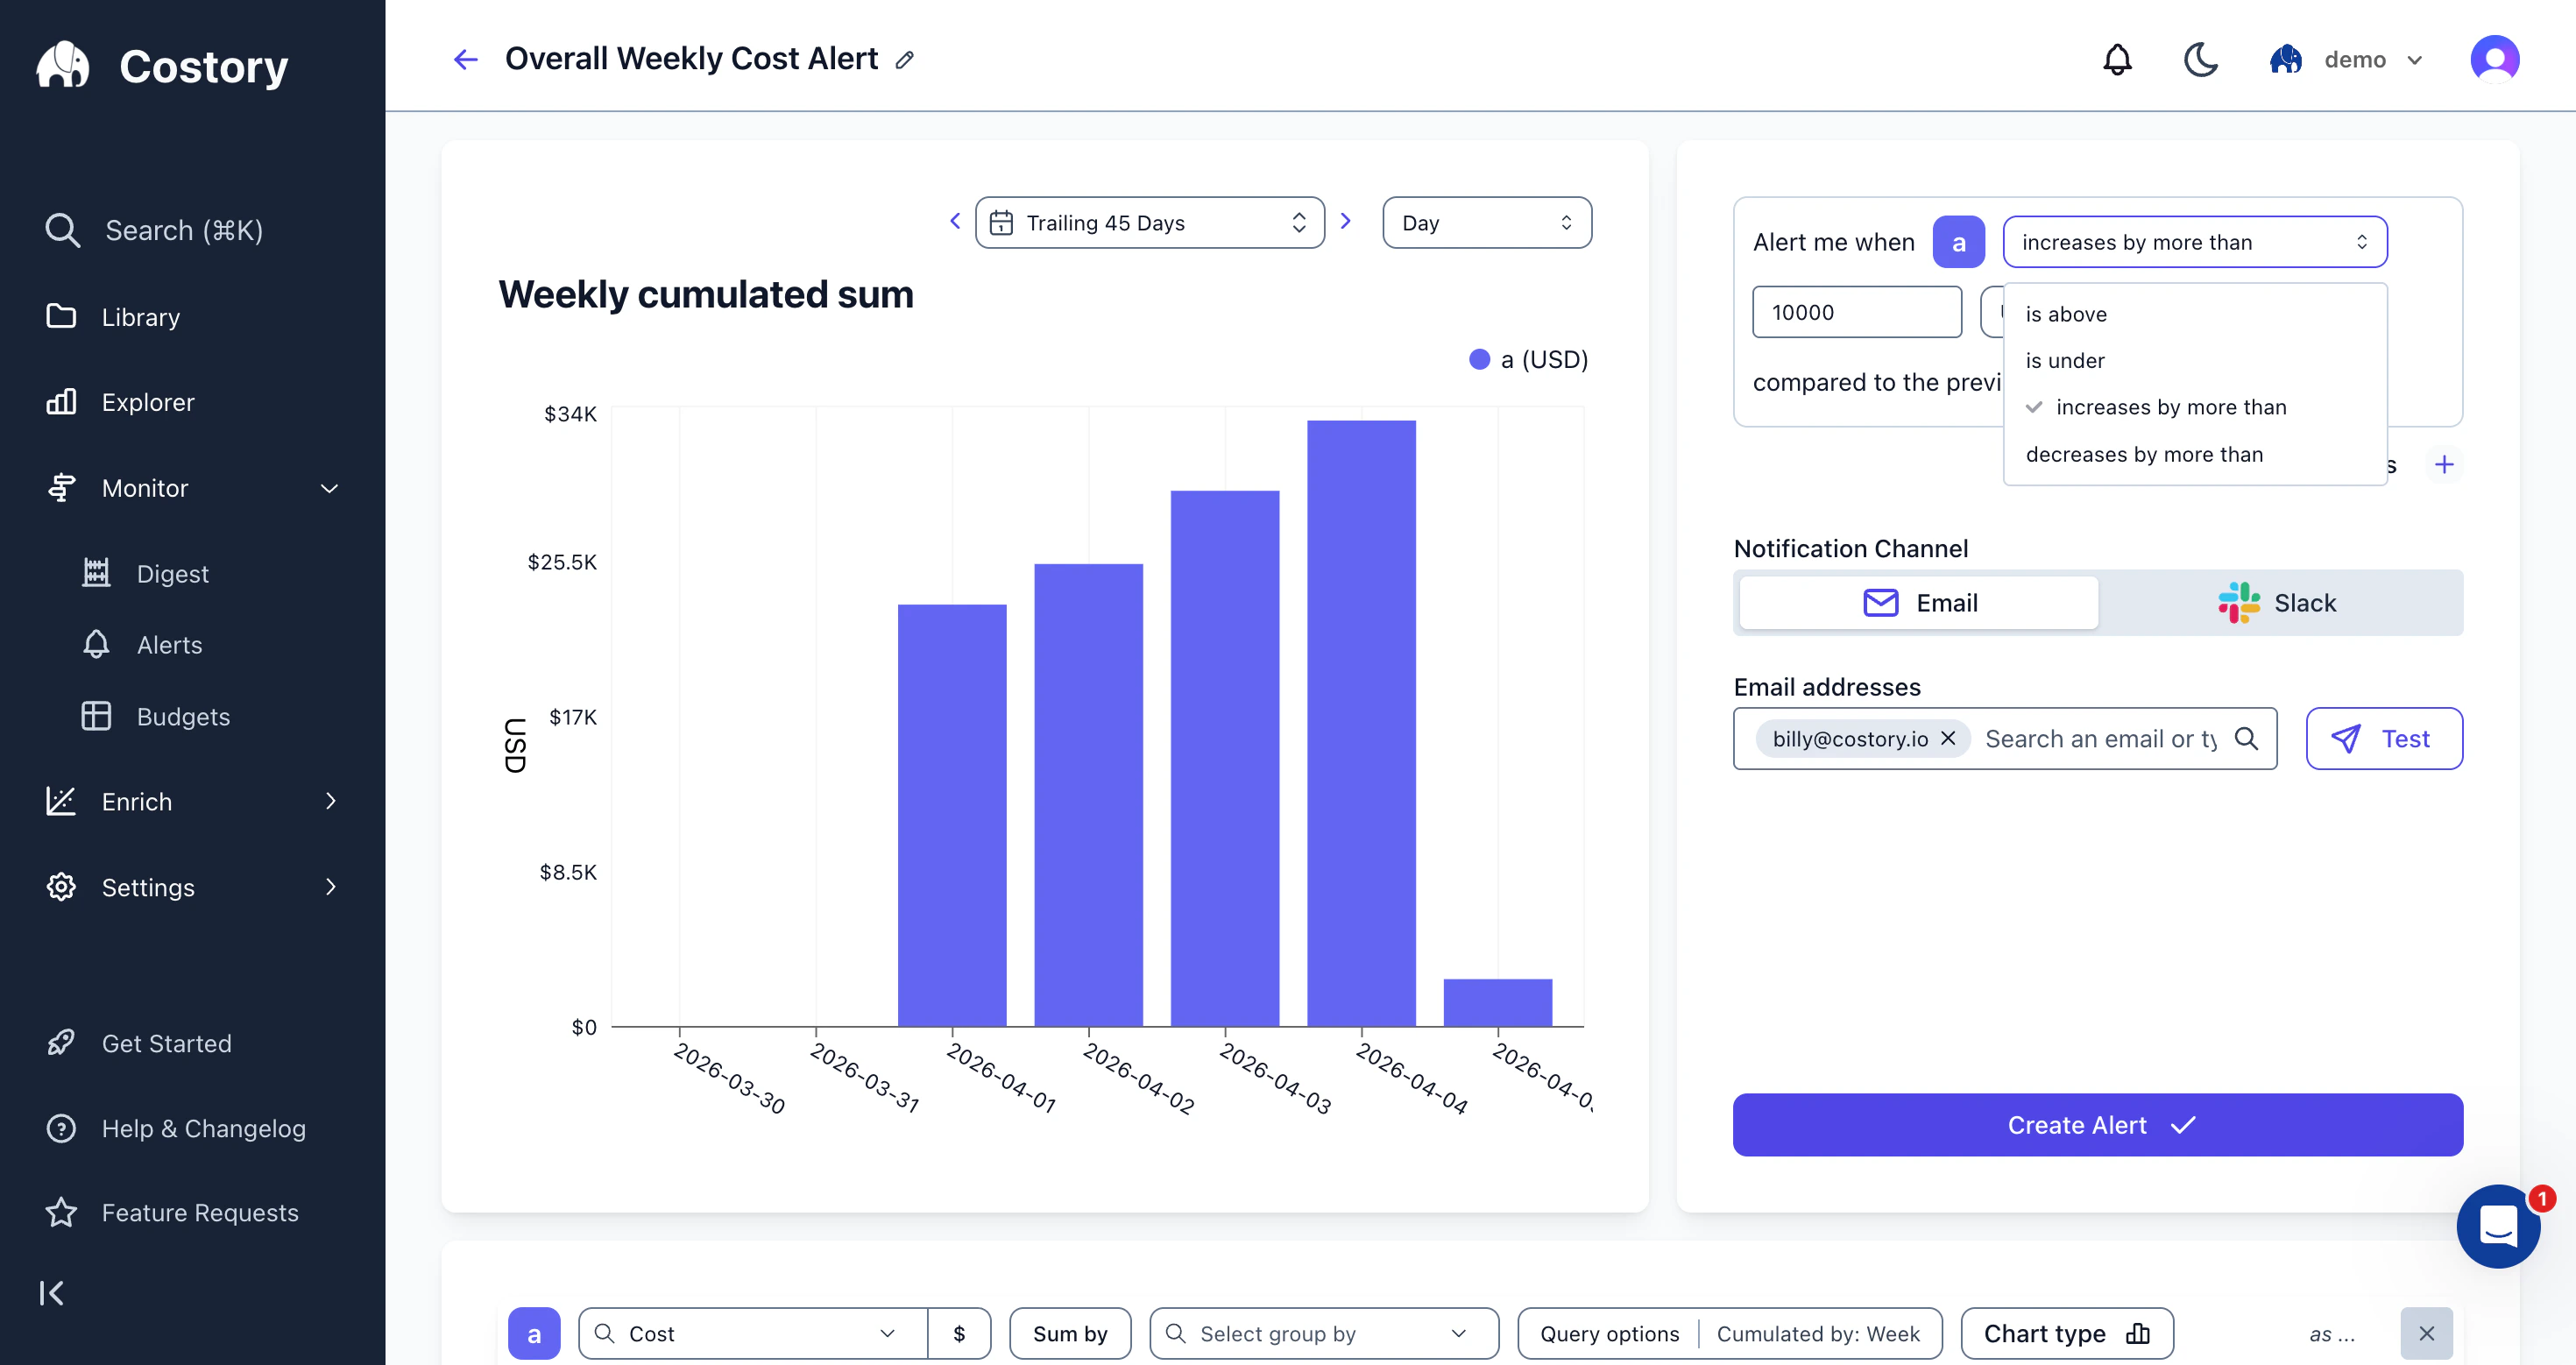
Period-over-Period Cost Alerts
April 9 2026
New Billing Datasource
You can now import Elastic Cloud organization billing and instance costs to Costory using an Organization API key and Organization ID. Data is normalized into so you can explore Elastic spend next to AWS, GCP, Azure, and other billing datasources.See the new Elastic Cloud billing setup guide for step-by-step instructions.April 1 2026
New Metrics Datasource
You can now import custom usage metrics directly from AWS CloudWatch into Costory. Create an AWS CloudWatch integration, paste your CloudWatch Insights query (for example S3BucketSizeBytes, HTTP request counts, CPU utilization, or SQS queue depth), and Costory will keep these metrics in sync alongside your billing data. This makes it easier to build unit economics like cost per request, cost per active user, or cost per GB stored using real infrastructure signals.See the new AWS CloudWatch usage metrics setup guide for step-by-step instructions and example queries.Small improvements
- Teams Usage public API endpoints are now available: see in https://app-api.costory.io/docs/
March 16 2026
Small improvements
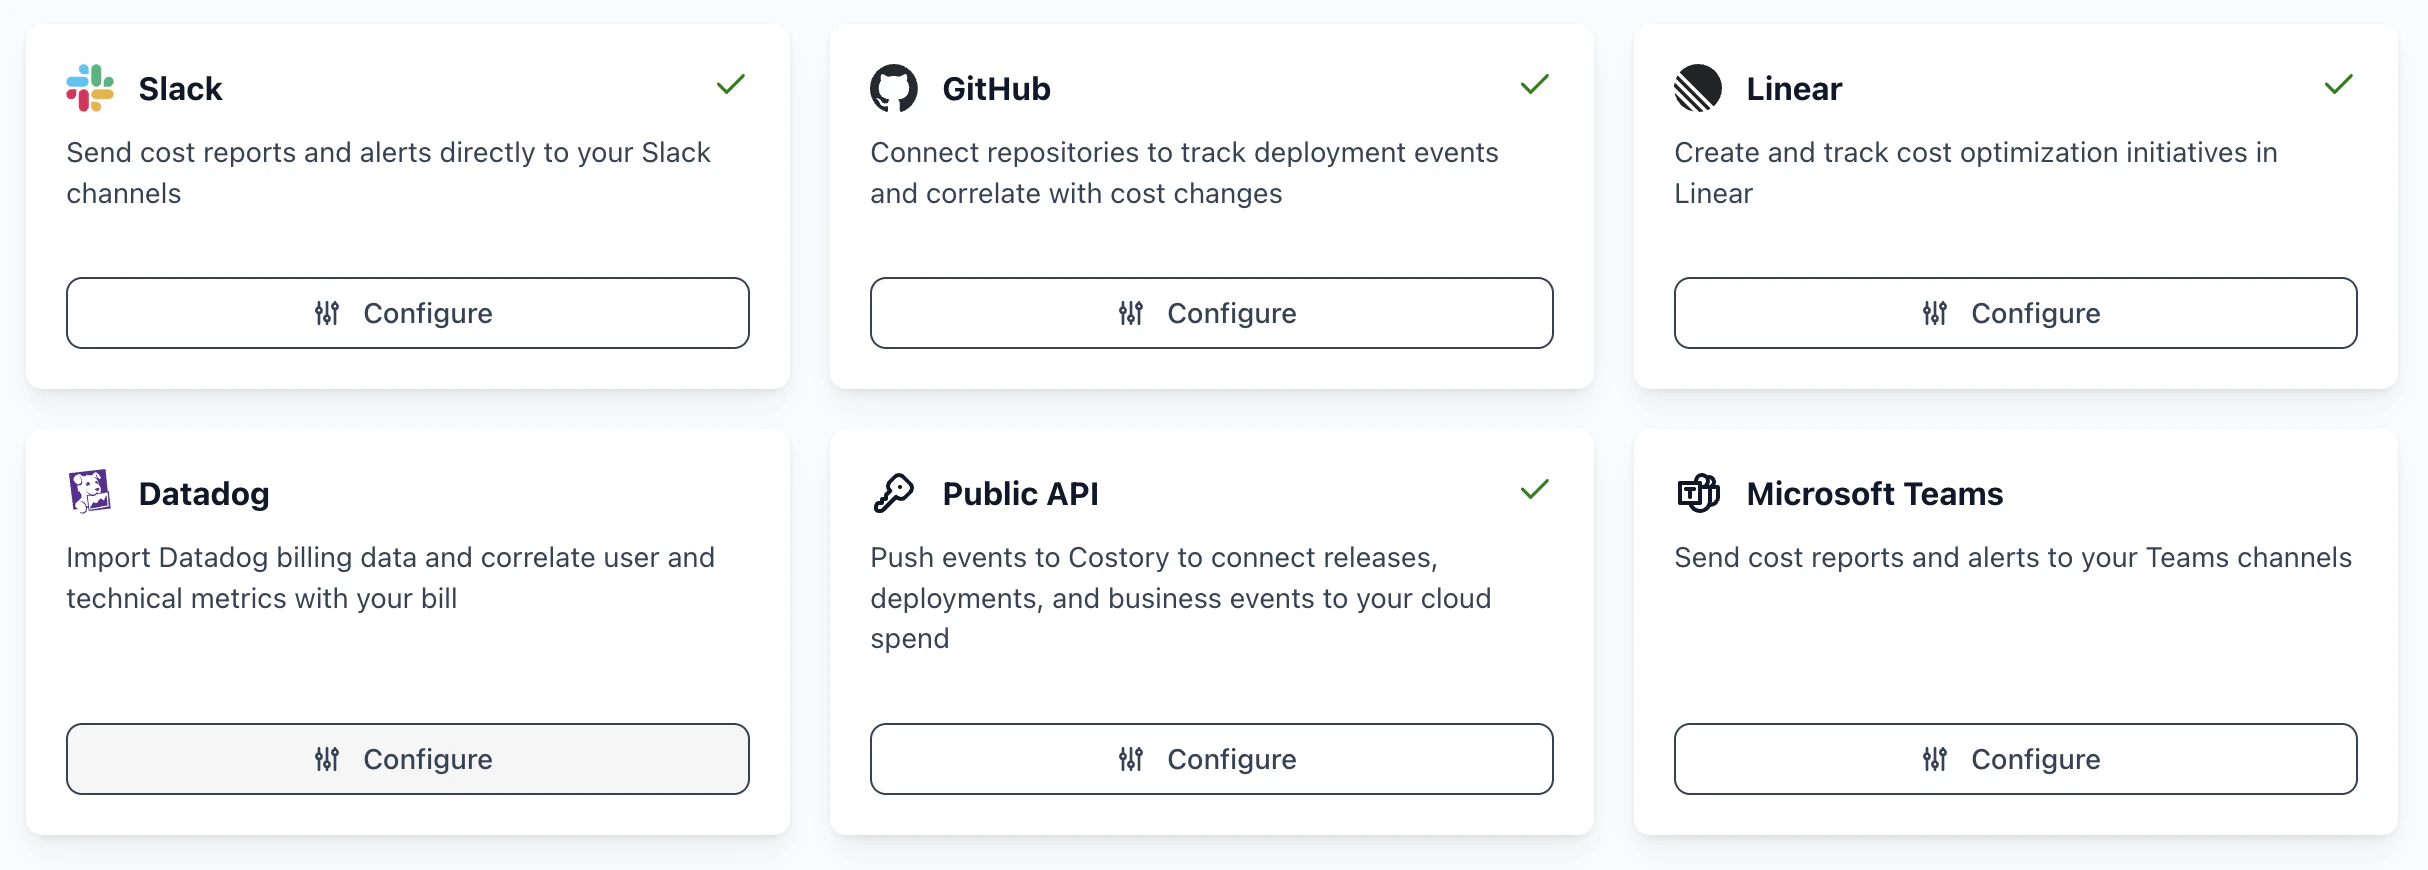
- You can set up billing data sources for AWS, Azure, GCP, Cursor, Anthropic, and more using a fully Terraform-based workflow. See Billing Data.
- The MCP experience is improved: see AI Assistant (MCP).
March 9 2026
Teams
A single cost view rarely works for an entire organization. Your backend squad needs scoped to their services, while finance needs Billed Cost across everything. Teams let you configure those defaults once so each group lands on the right numbers without manual filtering. Learn more in Teams.MCP (beta)
The MCP server is in beta. Read AI Assistant (MCP) and send feedback or suggestions to help shape what ships next.March 2 2026
Small improvements
- When a virtual dimension finishes computing and appears in the explorer, you get a notification in the top-right corner. The same applies to other long-running tasks in Costory.
- Track Cursor and Anthropic Claude Code spend: use Cursor Billing Setup and Anthropic Billing Setup.
Feb 24 2026
Events Page
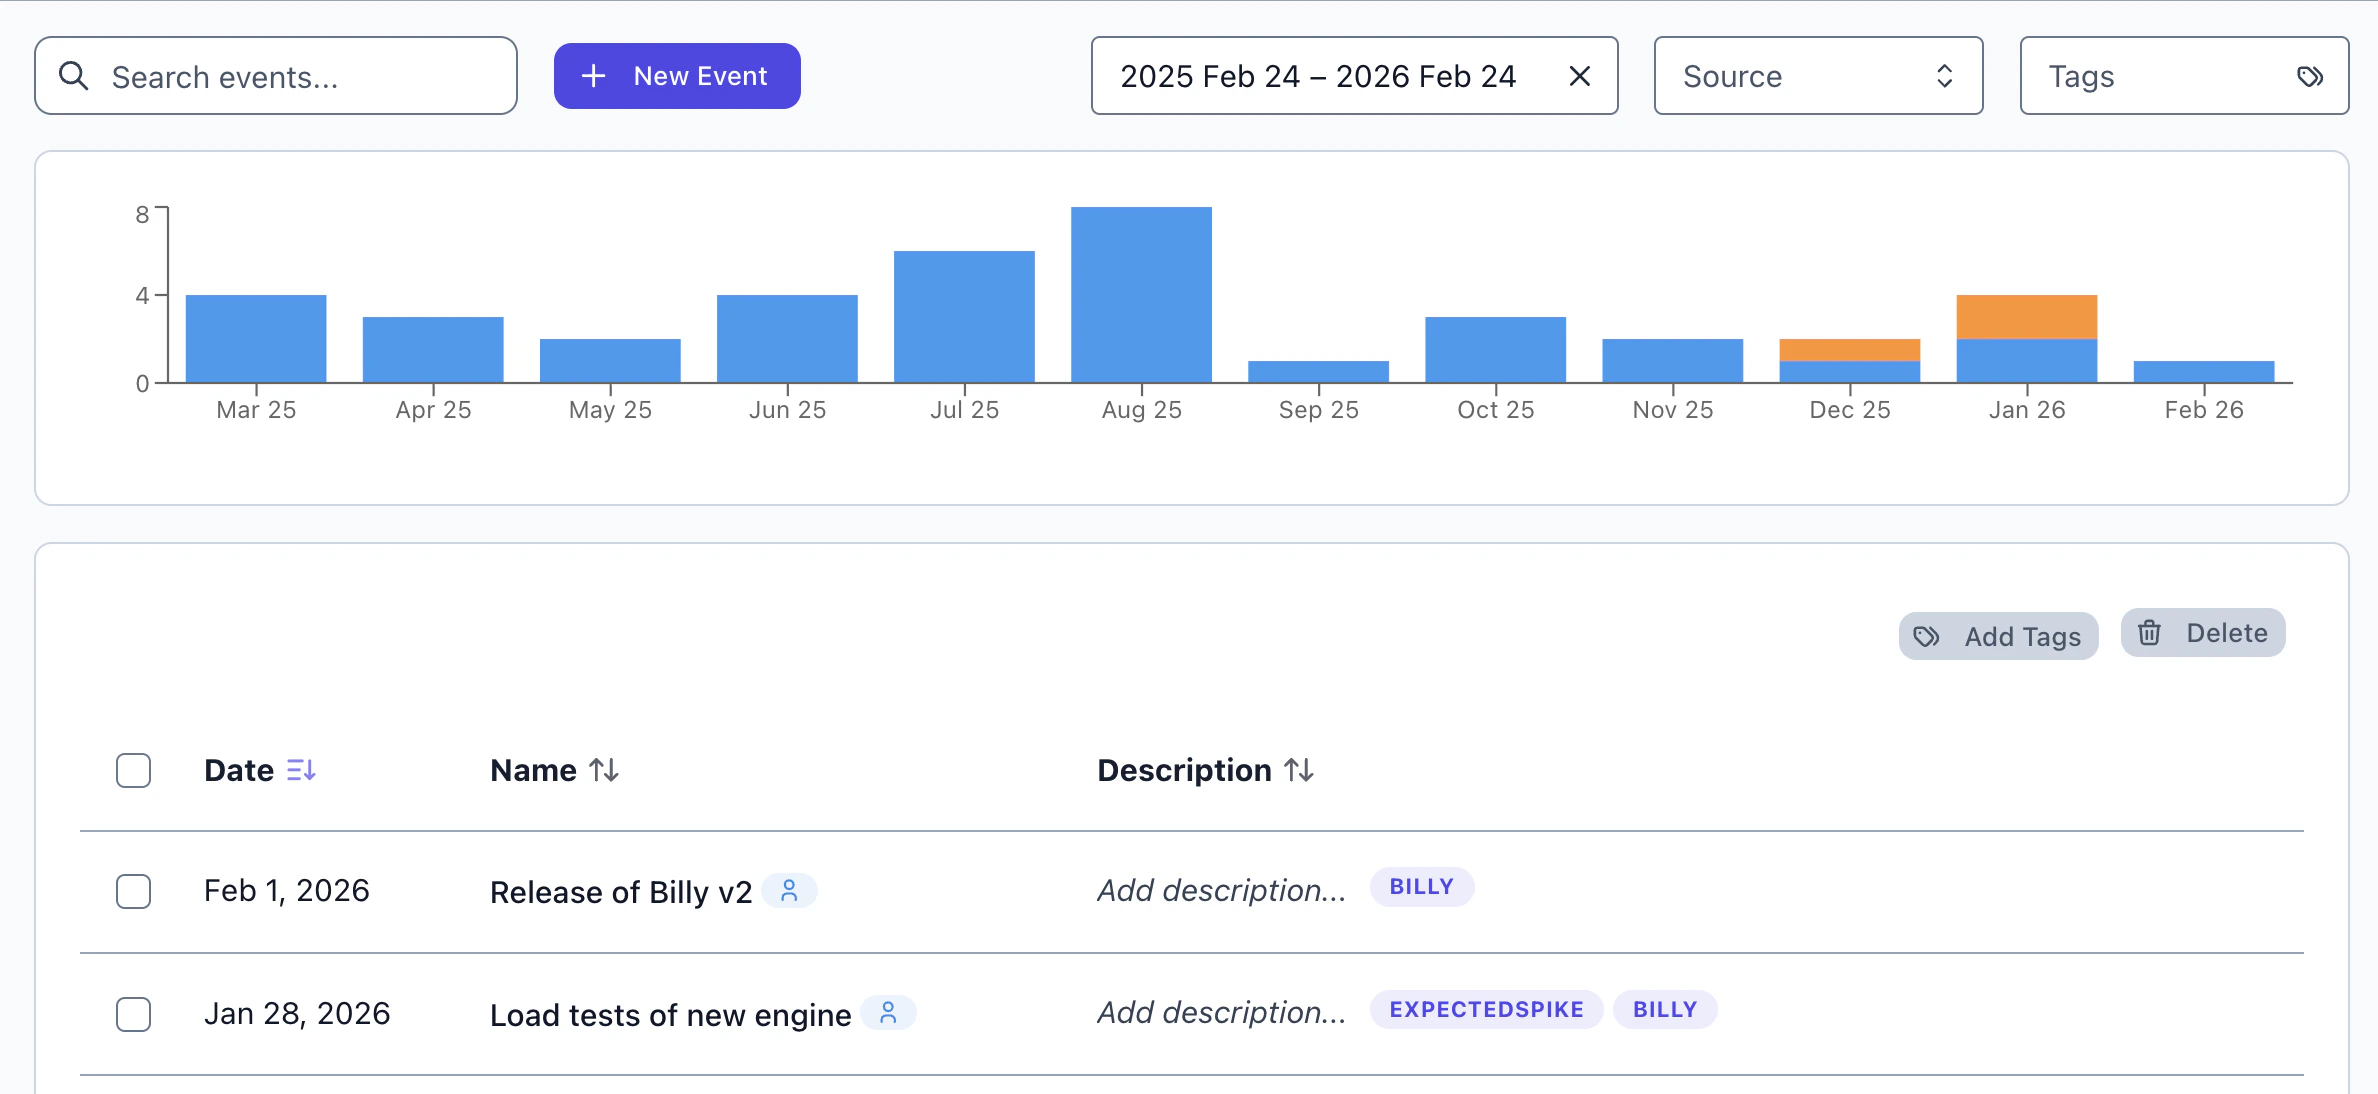
- Browse all events with metadata, tags, and provider information at a glance
- Inline explorer modal lets you see the cost impact of any single event without leaving the page
- Save as Context: jump directly from an event into Explorer with filters pre-filled, so you can immediately drill into the cost impact
Budget Configuration
Feb 19 2026
Sharing & Collaboration
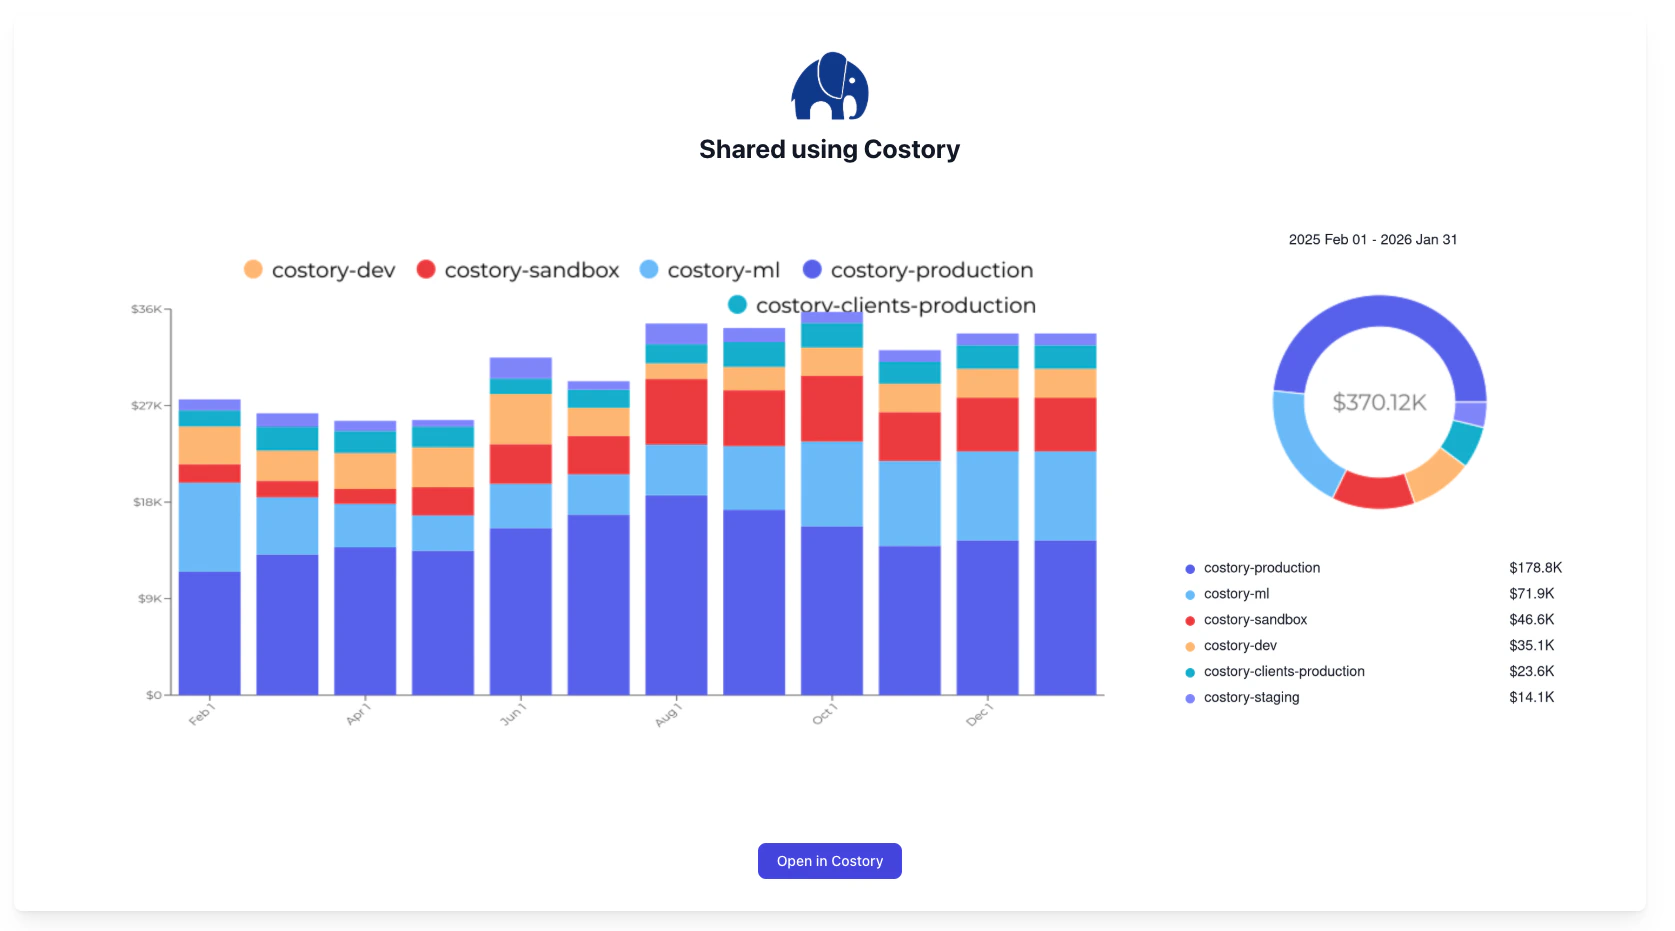
- Image sharing: export any Explorer view as an image to share with your team
- Slack previews: shared views now render a rich preview directly in Slack, so recipients get context before clicking through
- Public share pages: generate a shareable link for any view, accessible without logging in
Dashboard Widget Duplication
Duplicate any widget on a dashboard with a single click. The copy inherits all configuration — filters, groupings, and layout — so you can quickly create variations without starting from scratch.Feb 12 2026
Templated Dashboards
Reports from Explorer
Feb 9 2026
Dimensions
Consolidate scattered cost labels into clean, standardized dimensions with the Dimensions page: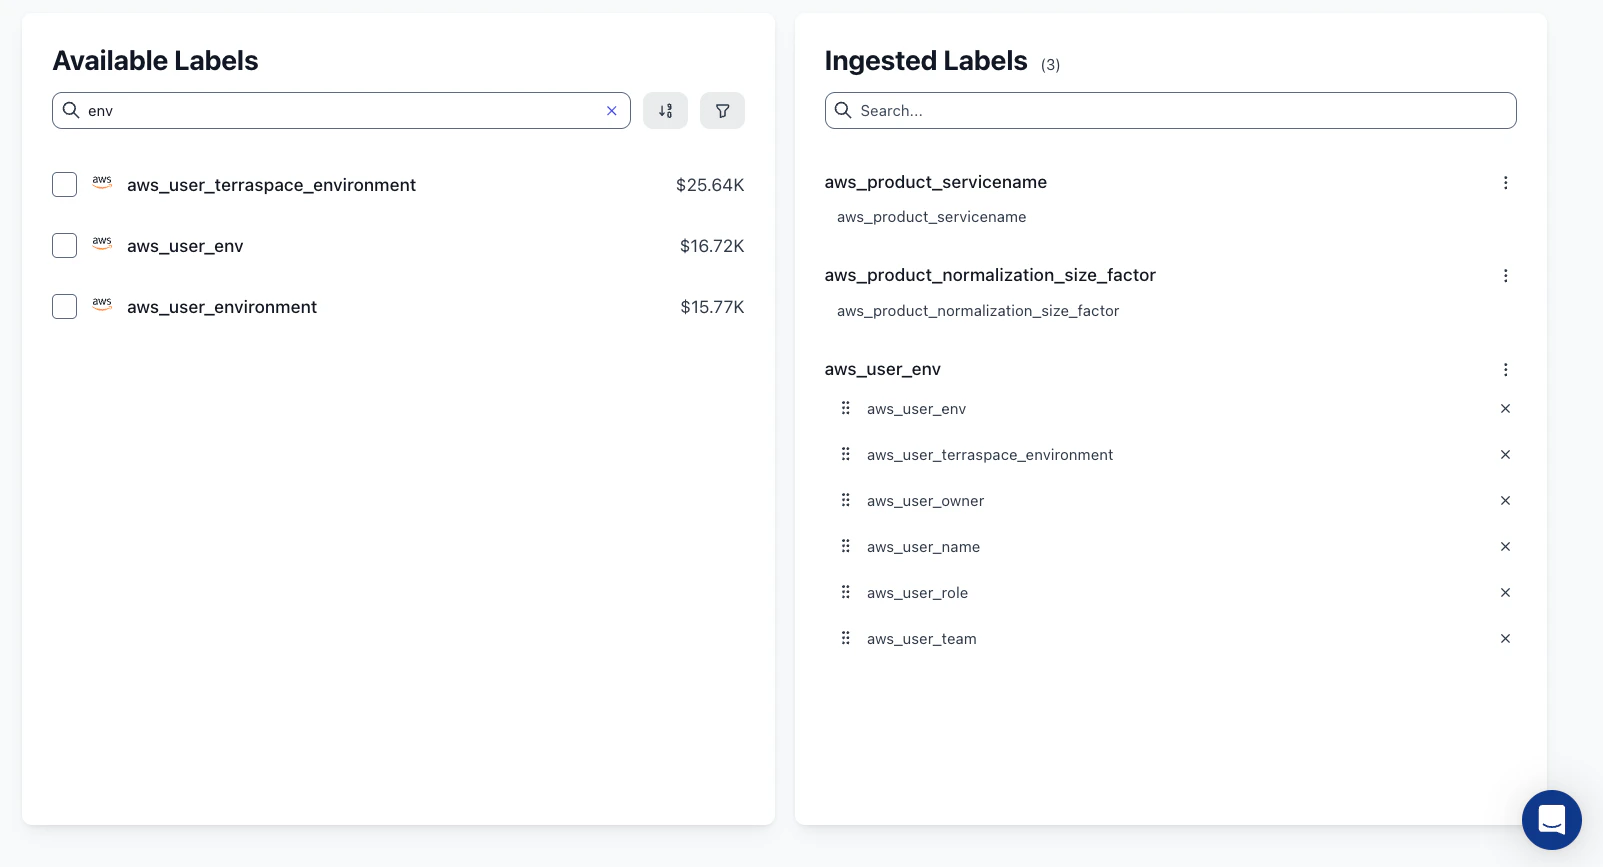
- Merge columns from multiple sources into a single logical label
- Map and rename values to standardize naming across providers (e.g., unify region names across AWS, GCP, and Azure)
- AI-powered similarity detection suggests values that should be grouped together, reducing manual effort
- Drag-and-drop reordering to organize your engineered labels
Feb 5 2026
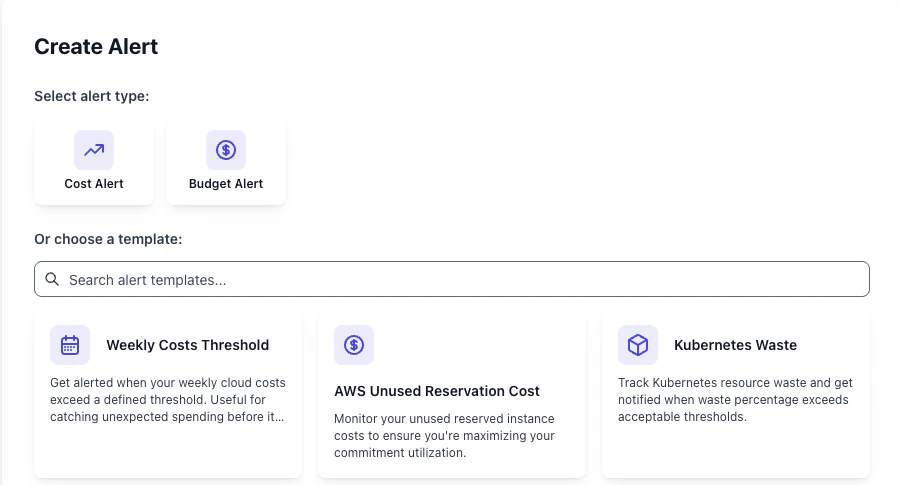
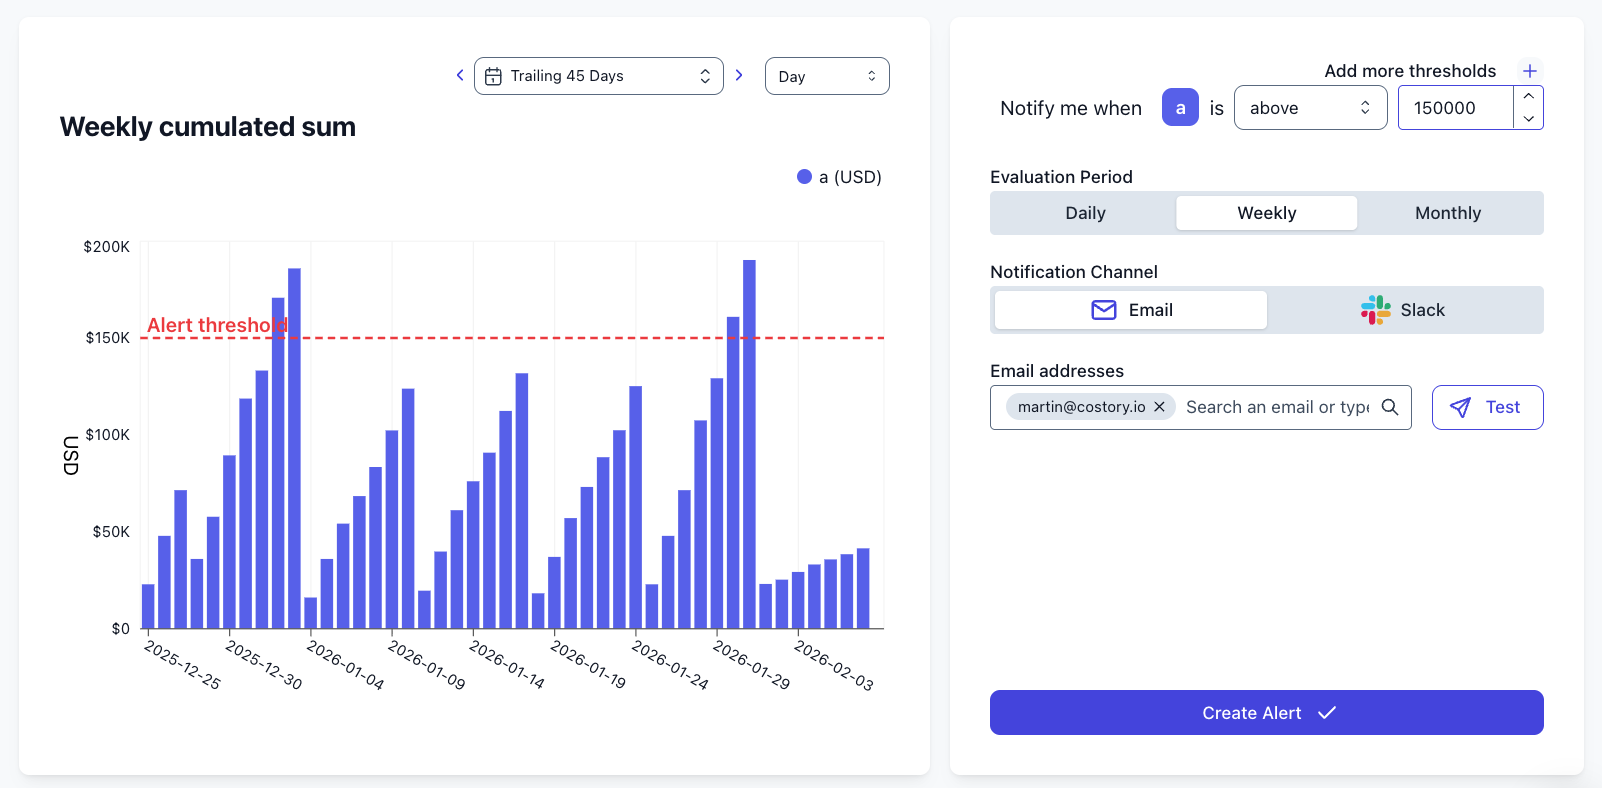
Smarter Alerts for Cost and Budget Monitoring
Stay ahead of cost anomalies with a redesigned alerts system supporting multiple alert types and notification channels: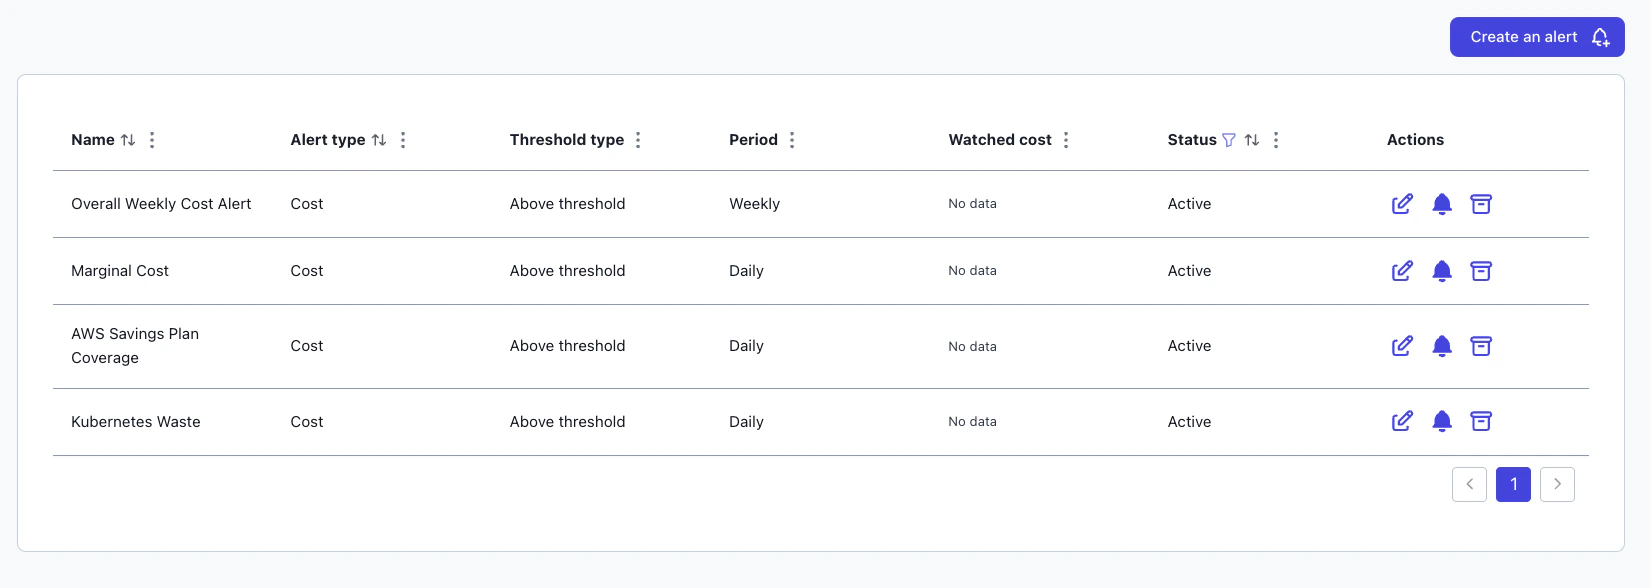
- Cost Alerts monitor actual spending against custom thresholds — get notified when costs spike or drop unexpectedly
- Budget Alerts track spend against allocated budgets with percentage-based triggers and automatic owner notifications
- Multi-threshold severity levels (Info, Warning, Alert) with daily, weekly, or monthly evaluation periods
Feb 2 2026
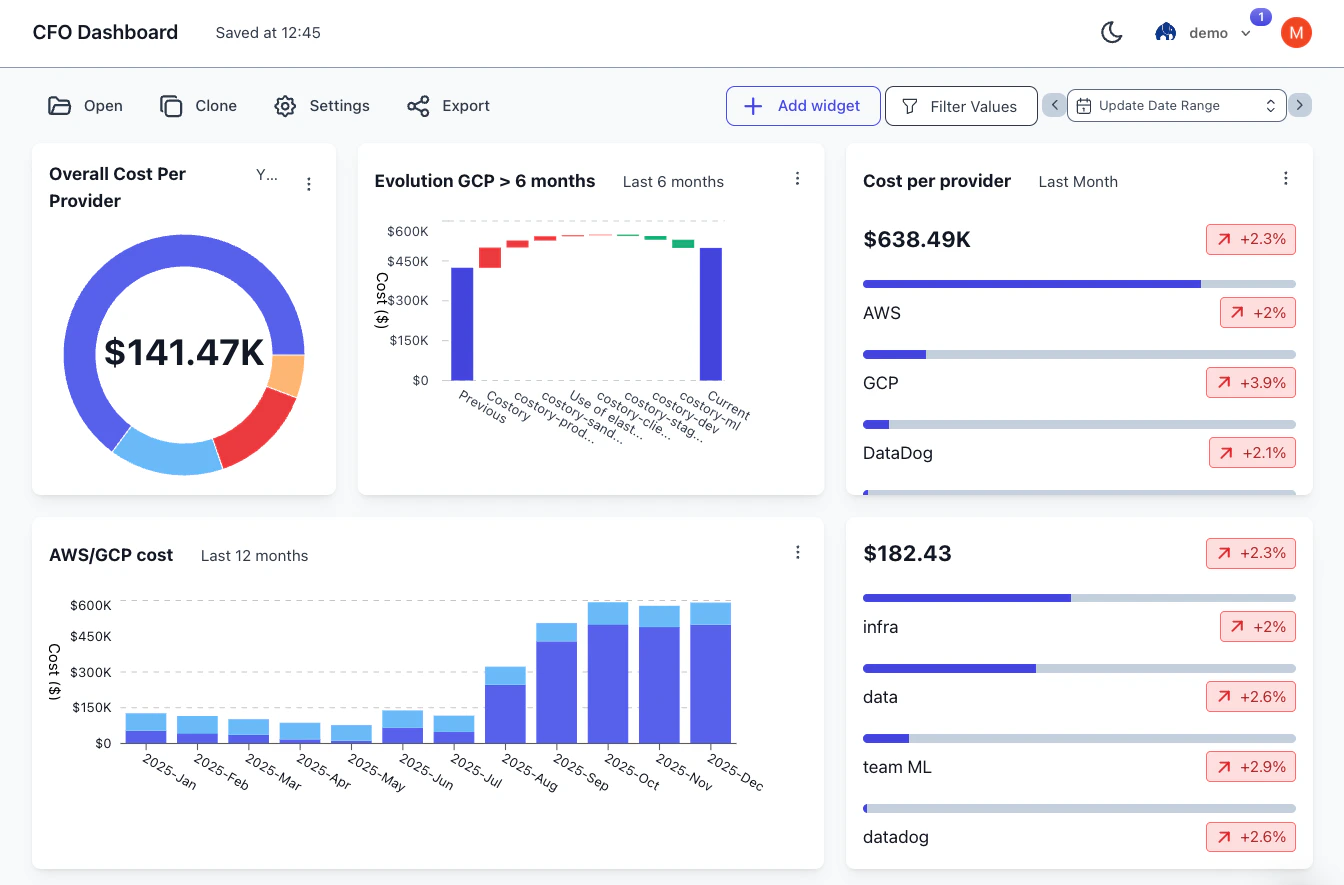
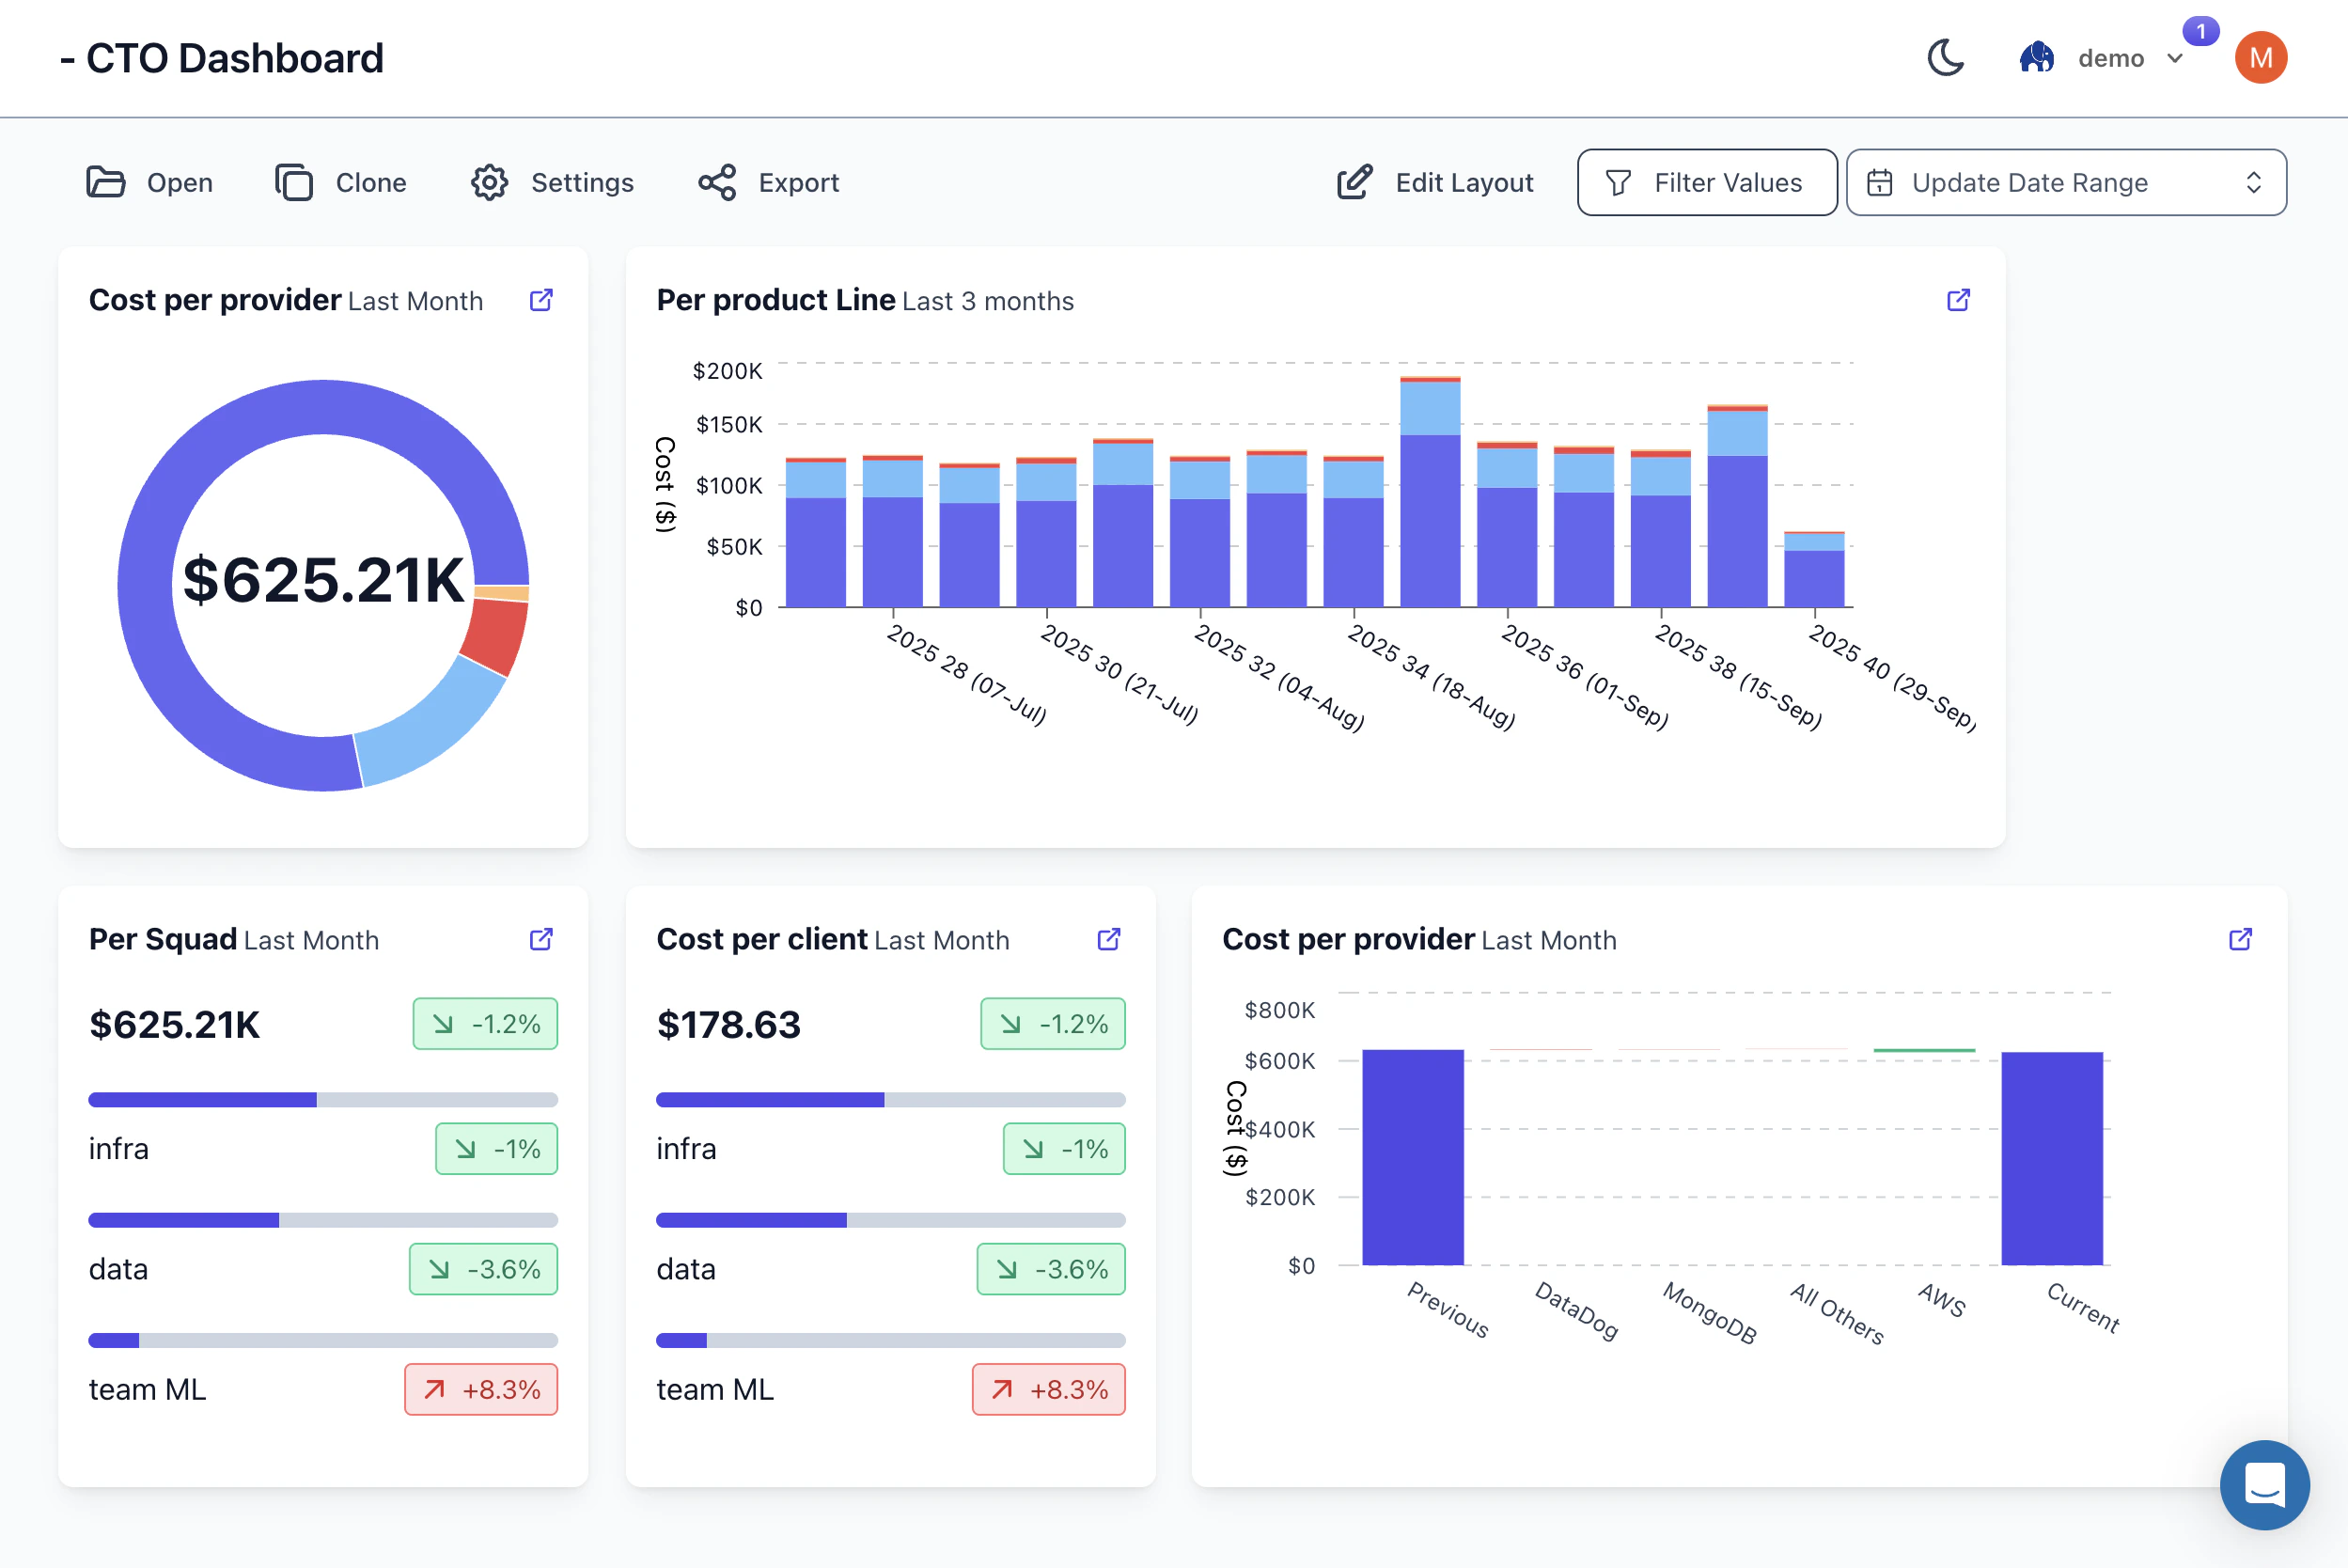
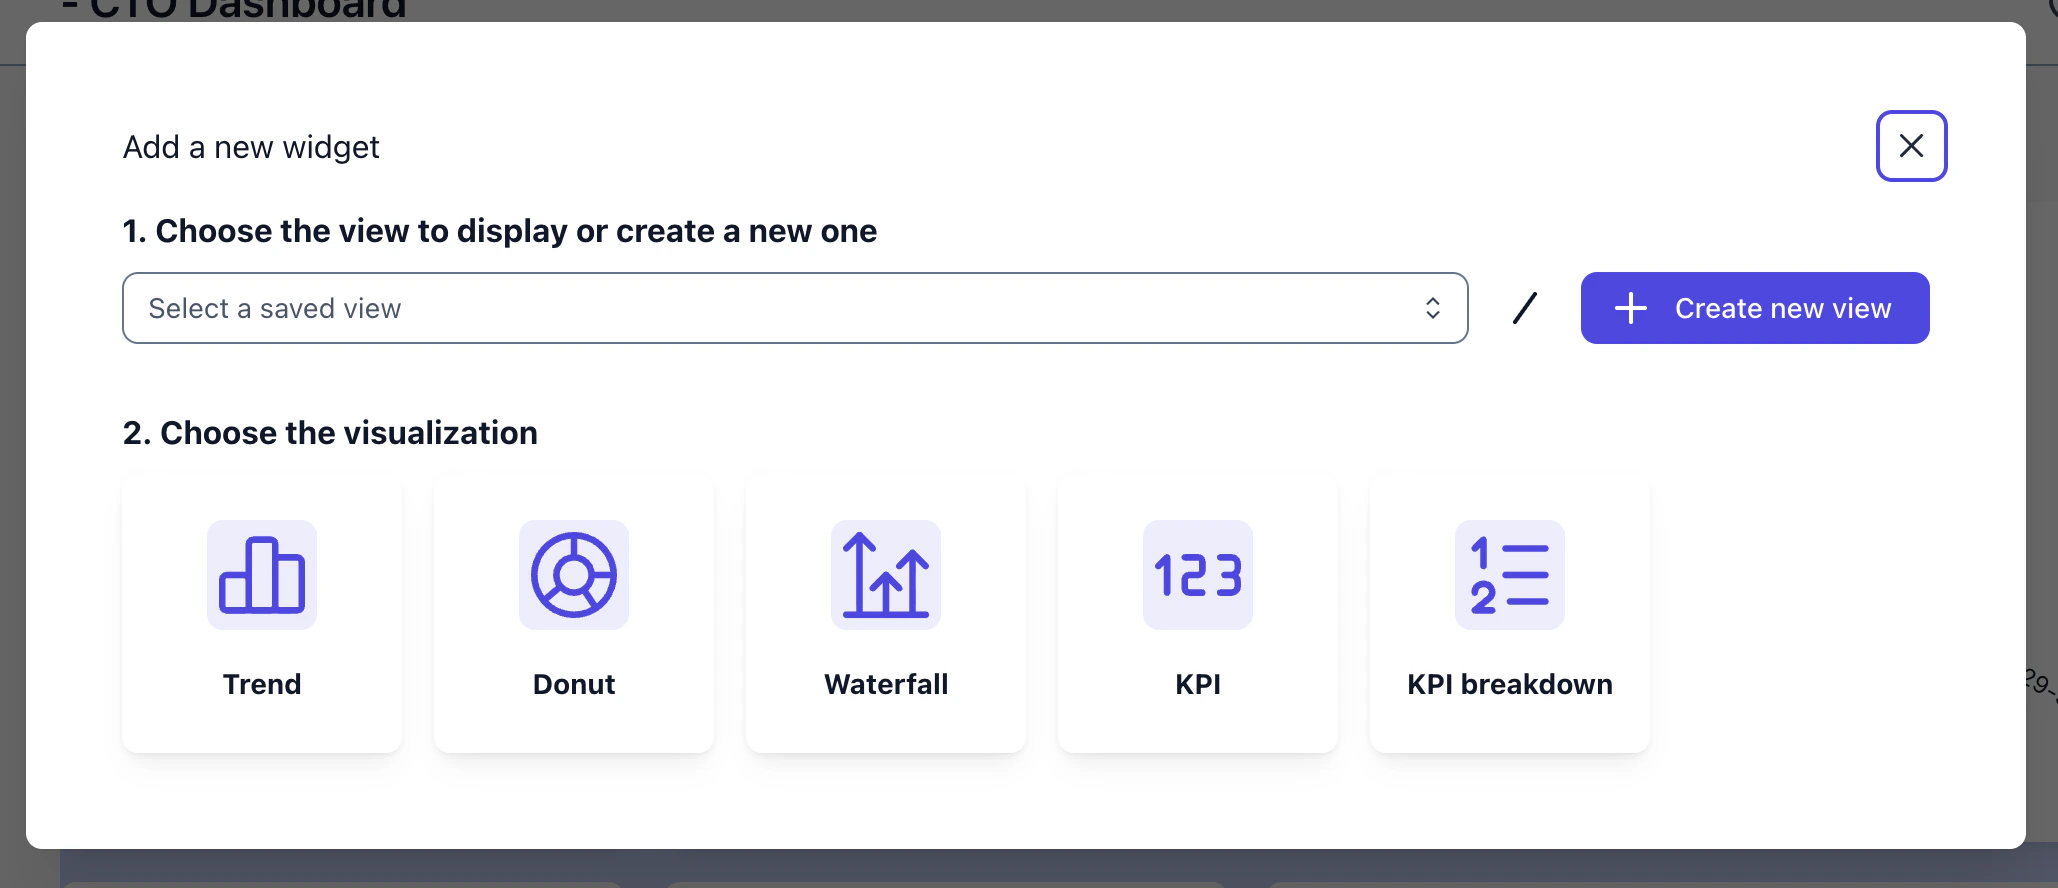
Dashboards with Explorer
Dashboards can now be edited in-line in Explorer, allowing you to change titles, resize tiles, and add and delete widgets with fewer clicks. Further changes:- Creating a dashboard widget no longer requires saving a view
- Dashboards now support Text widgets for additional context
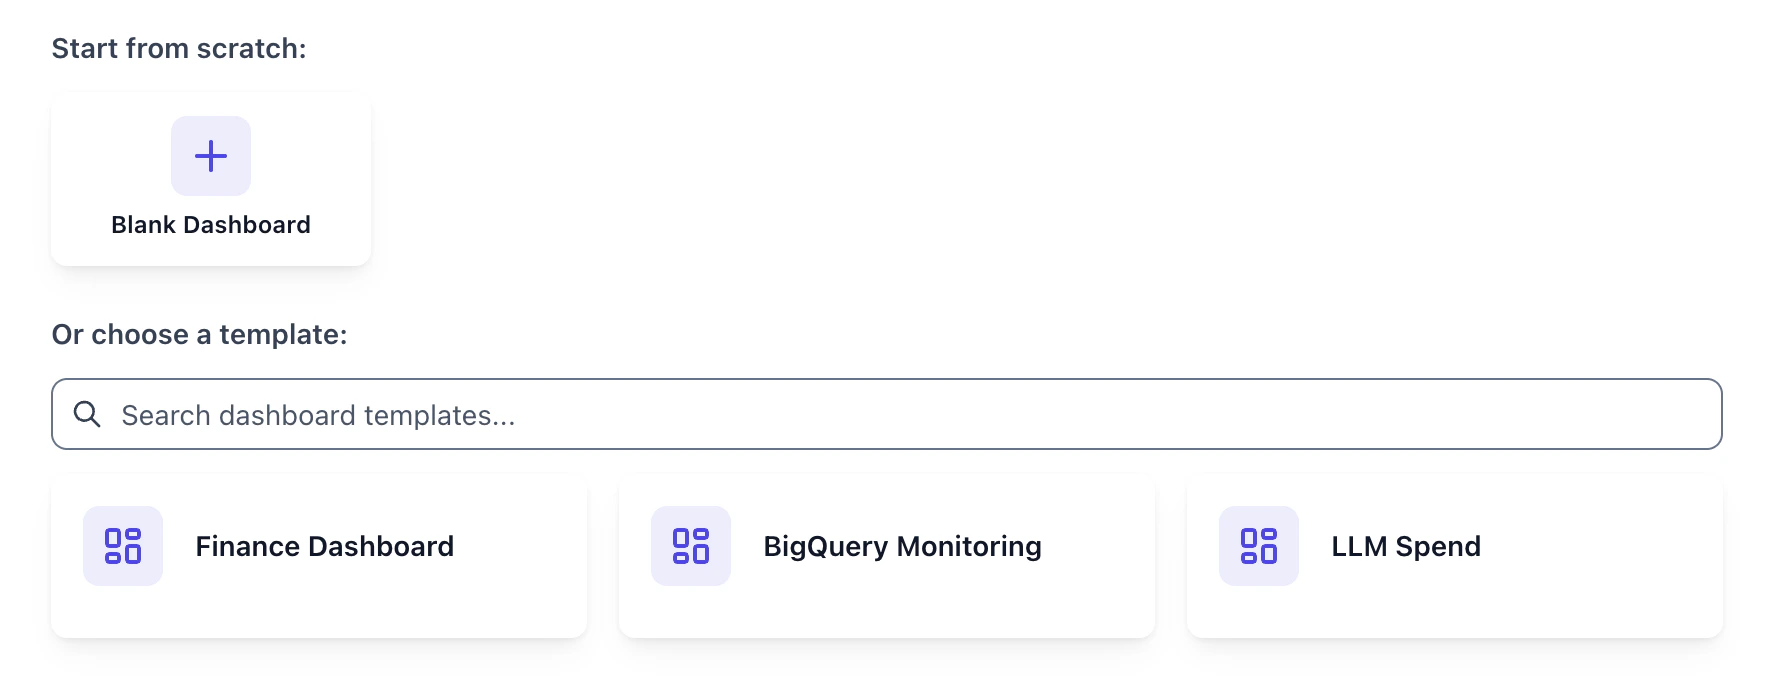
- Templates allowing you to get started faster than ever
Jan 30 2026
Introducing the new Explorer
Explorer shows where your cloud spend goes and adds multiple metrics, formulas, anomaly drill-downs, and reusable views.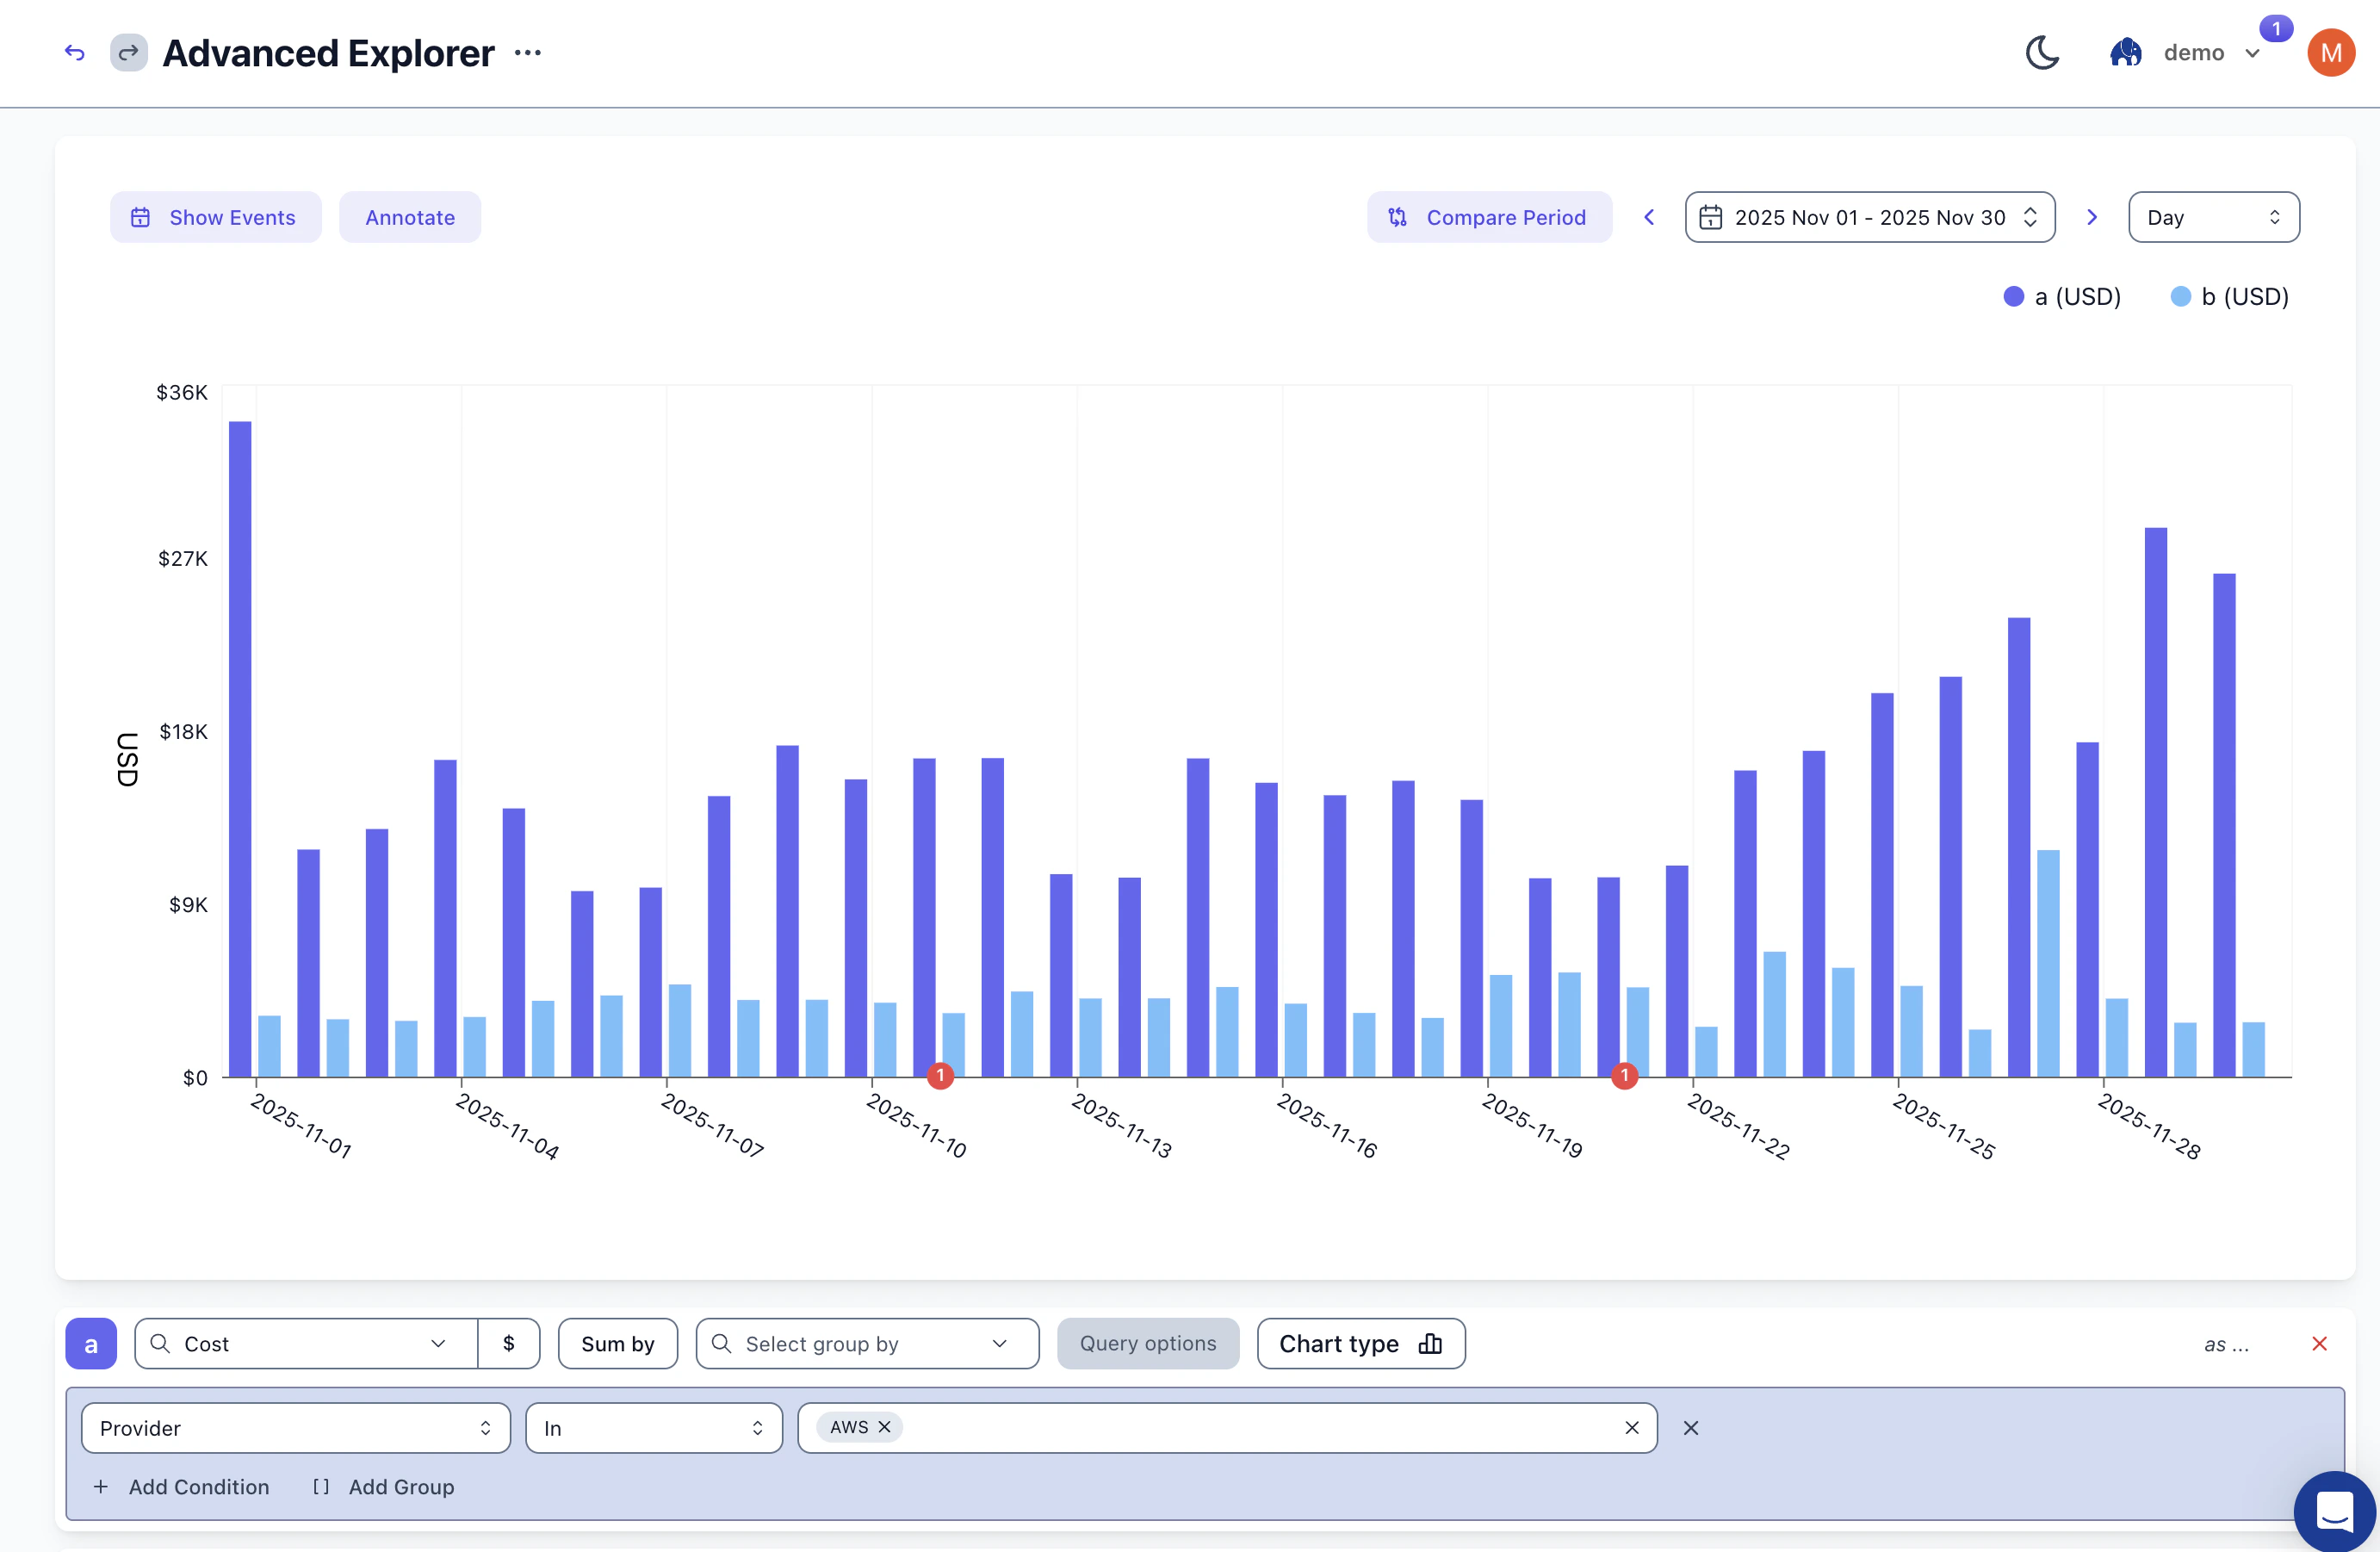
- Multiple Metrics: Plot cost alongside usage metrics, business KPIs, or custom data on the same chart. Each metric gets its own axis.
- Ad-hoc Formulas: Create calculated fields like cost-per-user or cost-per-request. Combine any metrics with arithmetic operations.
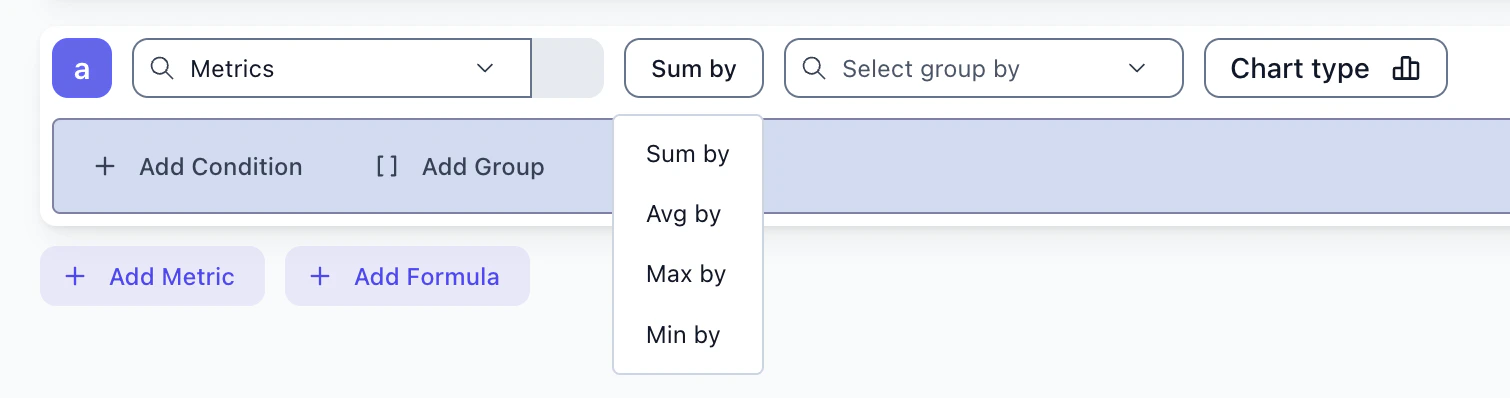
- Aggregations: Go beyond sum. Use average, max, or min to analyze your data the way you need.

Jan 23 2026
Jan 16 2026
New Setup Flows for AWS and Azure
Step-by-step setup flows for AWS and Azure with copy-paste commands and real-time validation. Our guided wizards walk you through creating cost exports and configuring permissions, with instant feedback to ensure everything is set up correctly.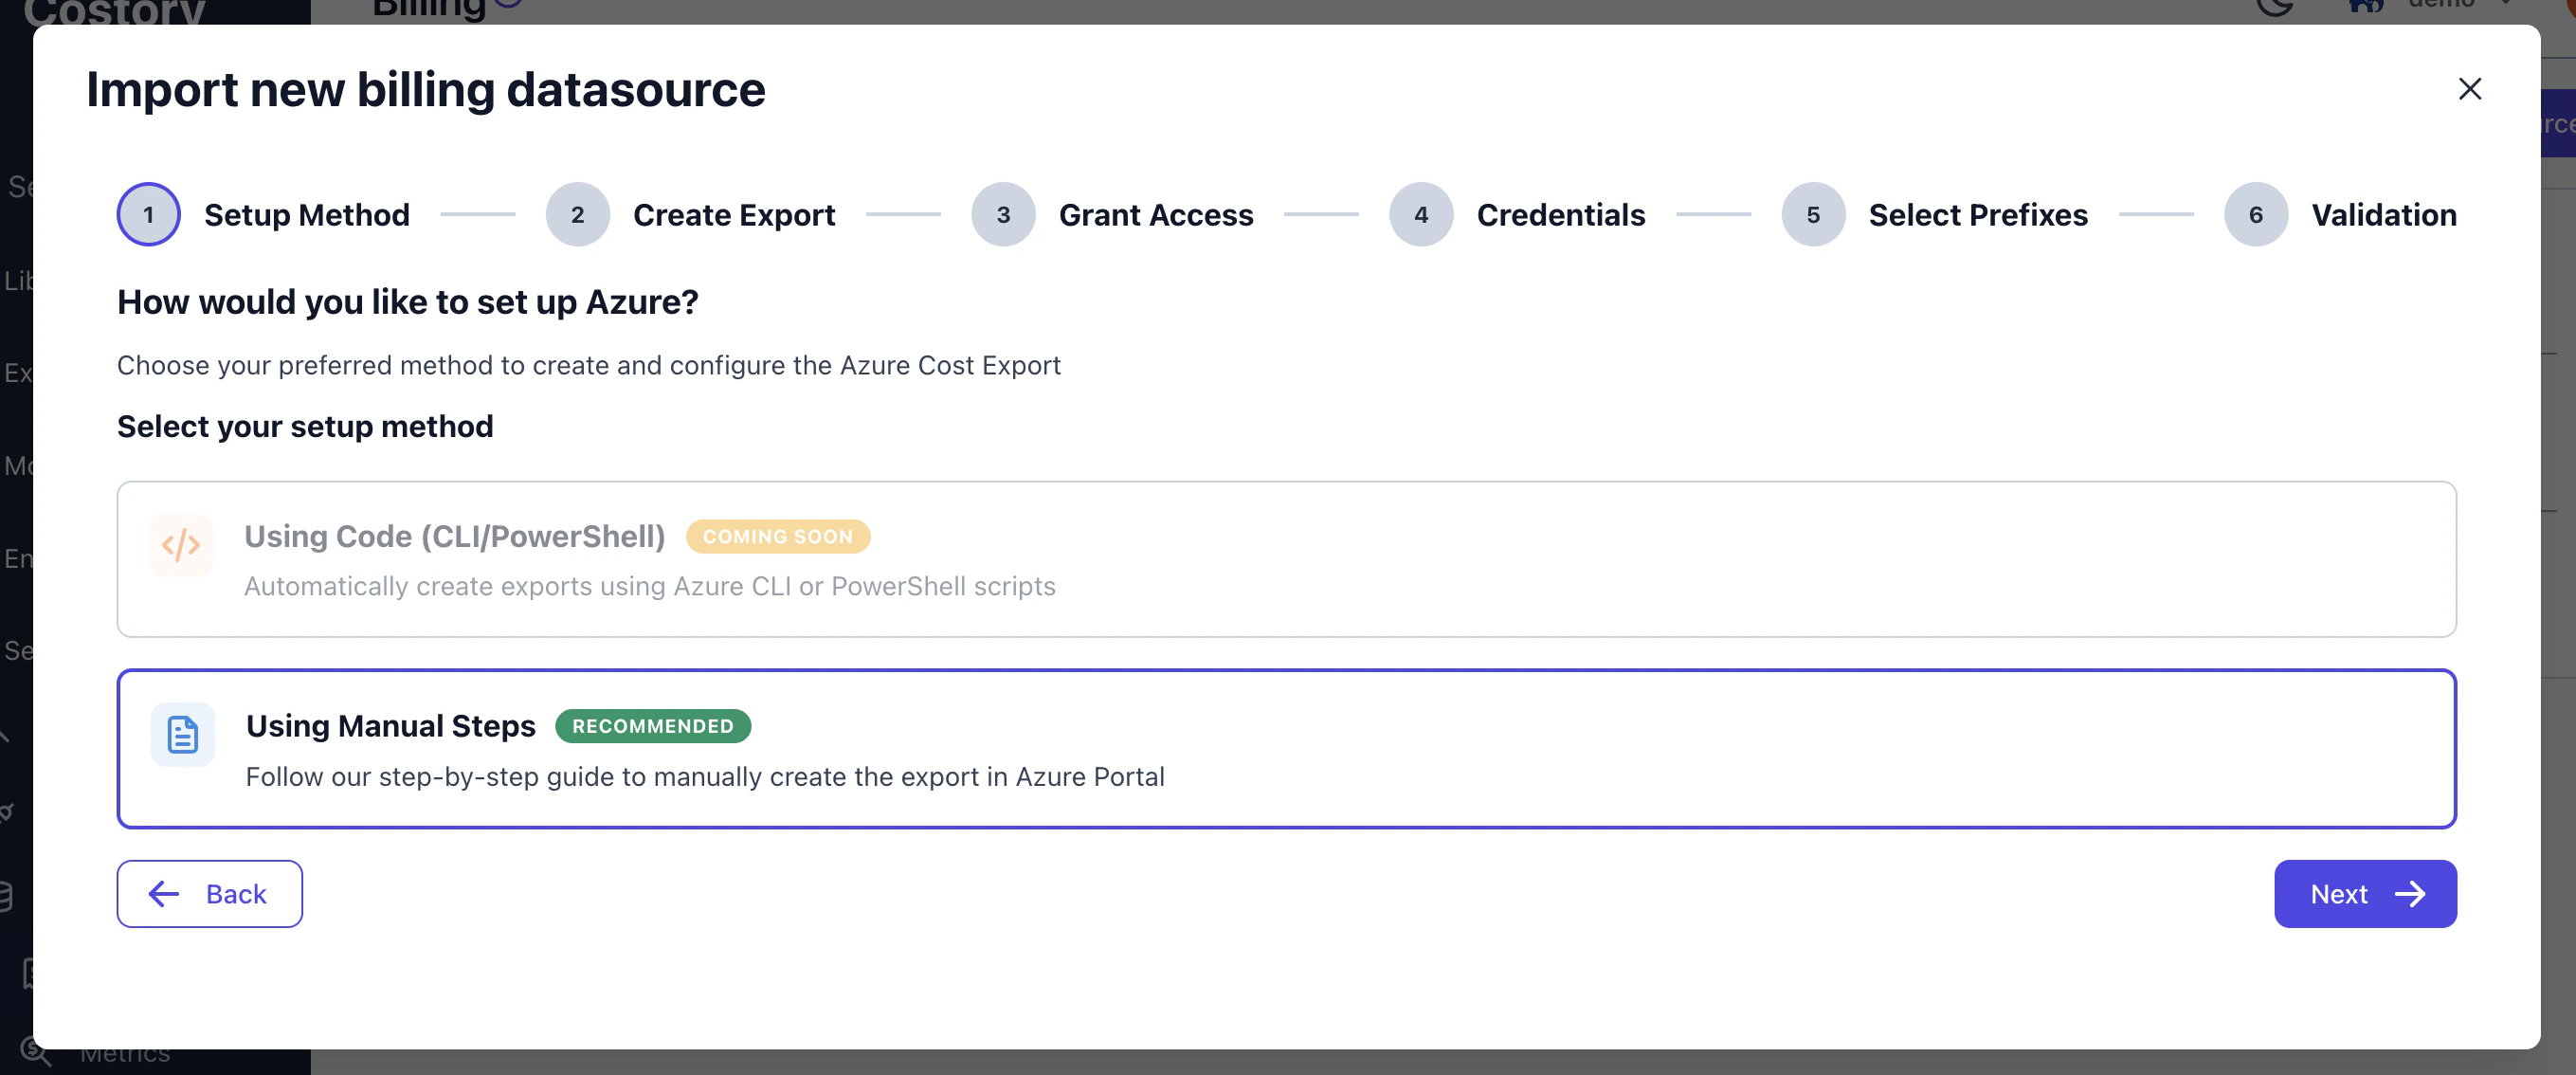
Jan 9 2026
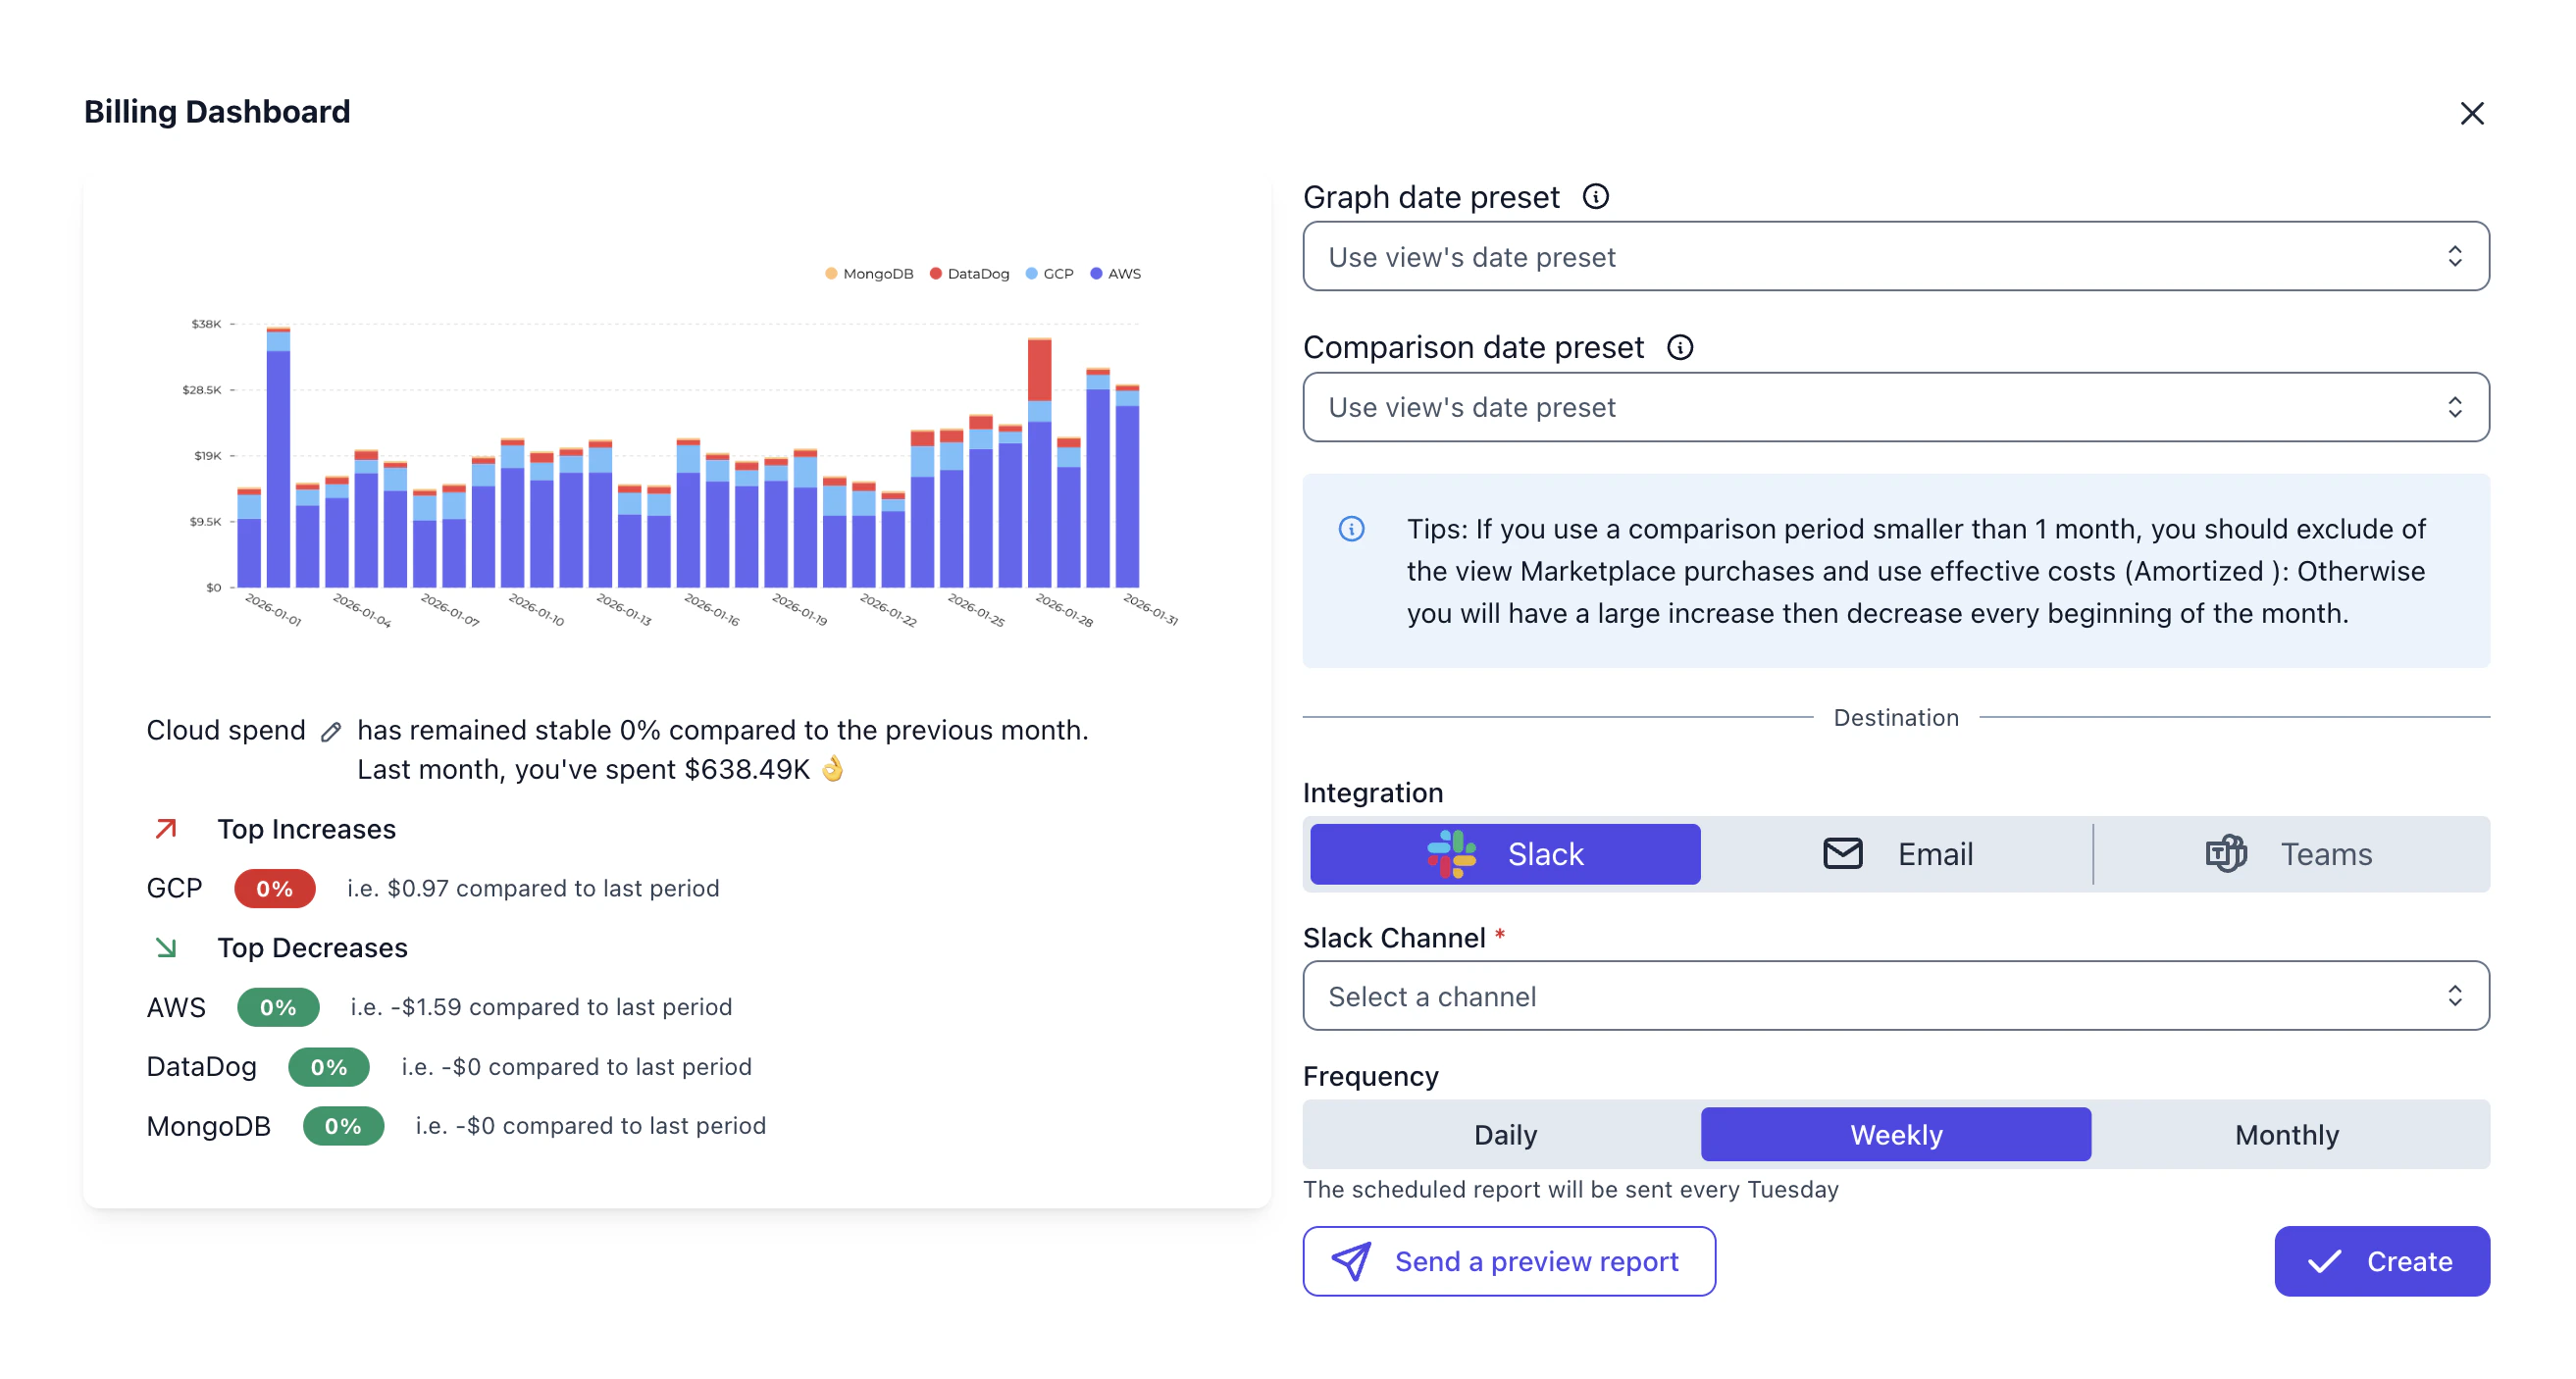
Daily Scheduled Reports
Scheduled reports now support daily frequency, so you can receive cost summaries every morning alongside your existing weekly and monthly schedules.Dec 26 2025
Dec 16 2025
Amplitude Integration
Correlate product usage with cloud costs. Connect your Amplitude project to bring Daily Active Users into Costory, then visualize usage trends alongside infrastructure spend. Supports both US and EU data regions with 12 months of historical data synced automatically.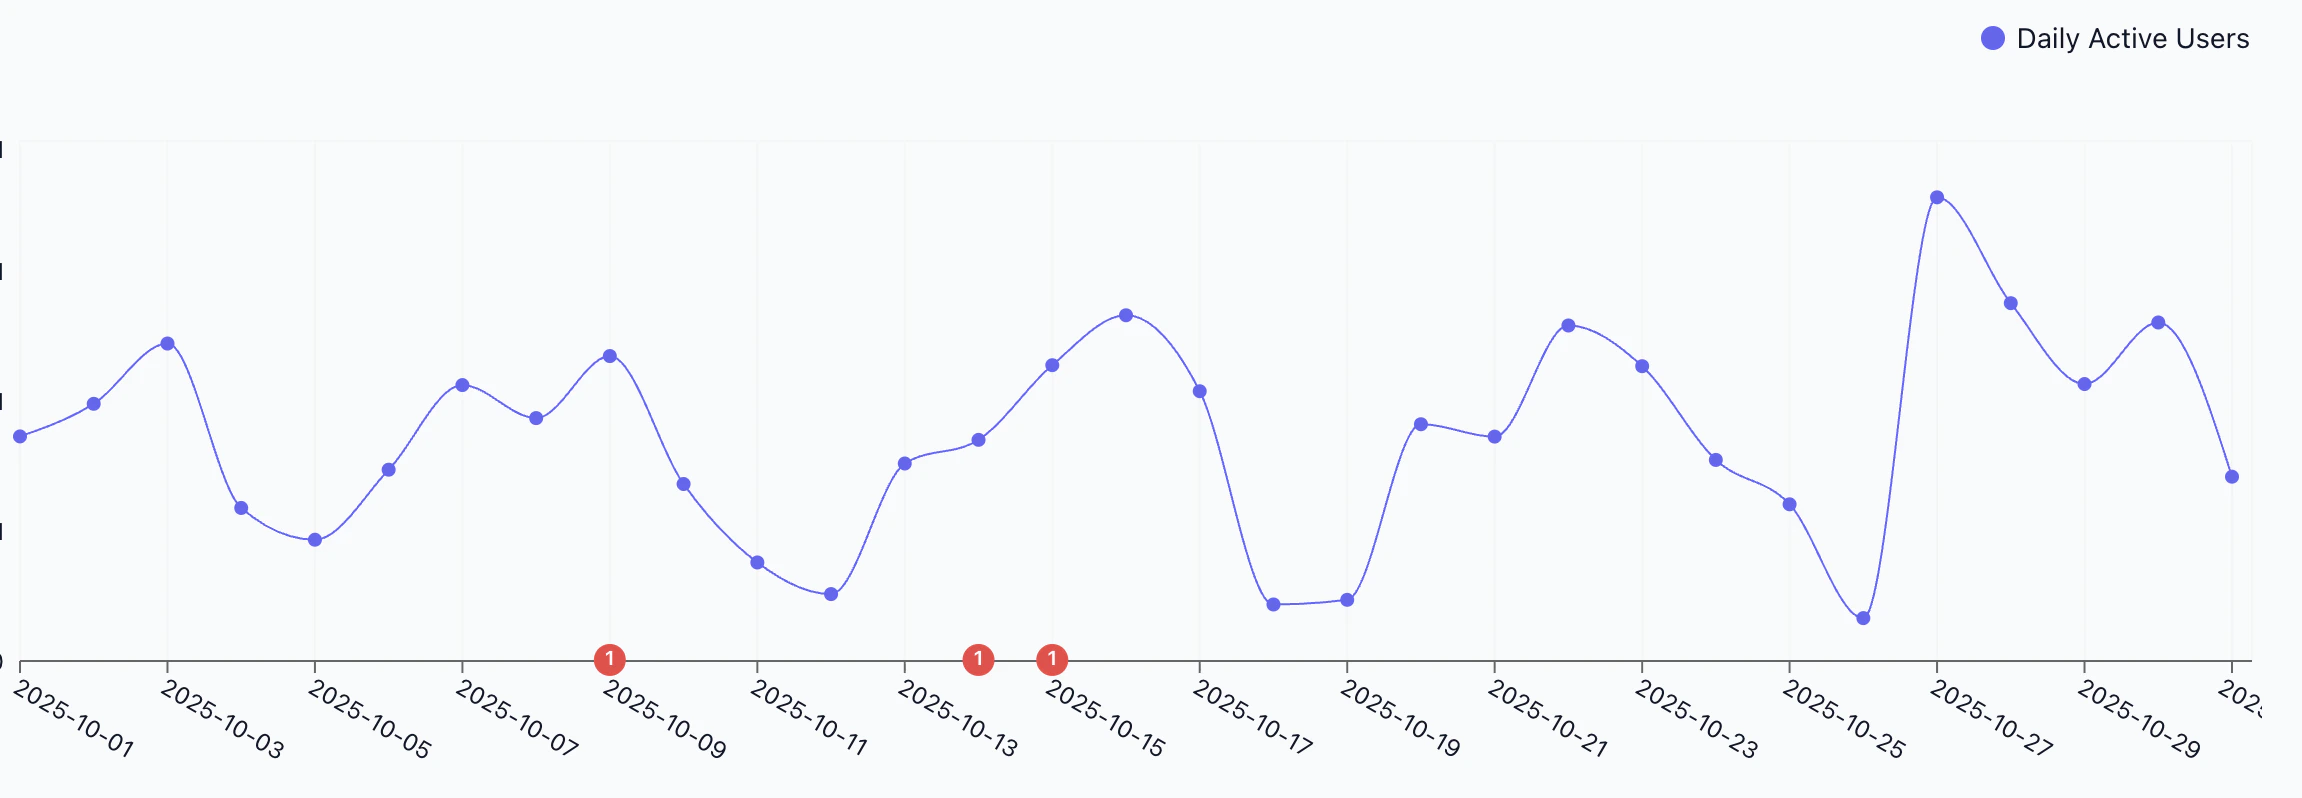
Dec 11 2025
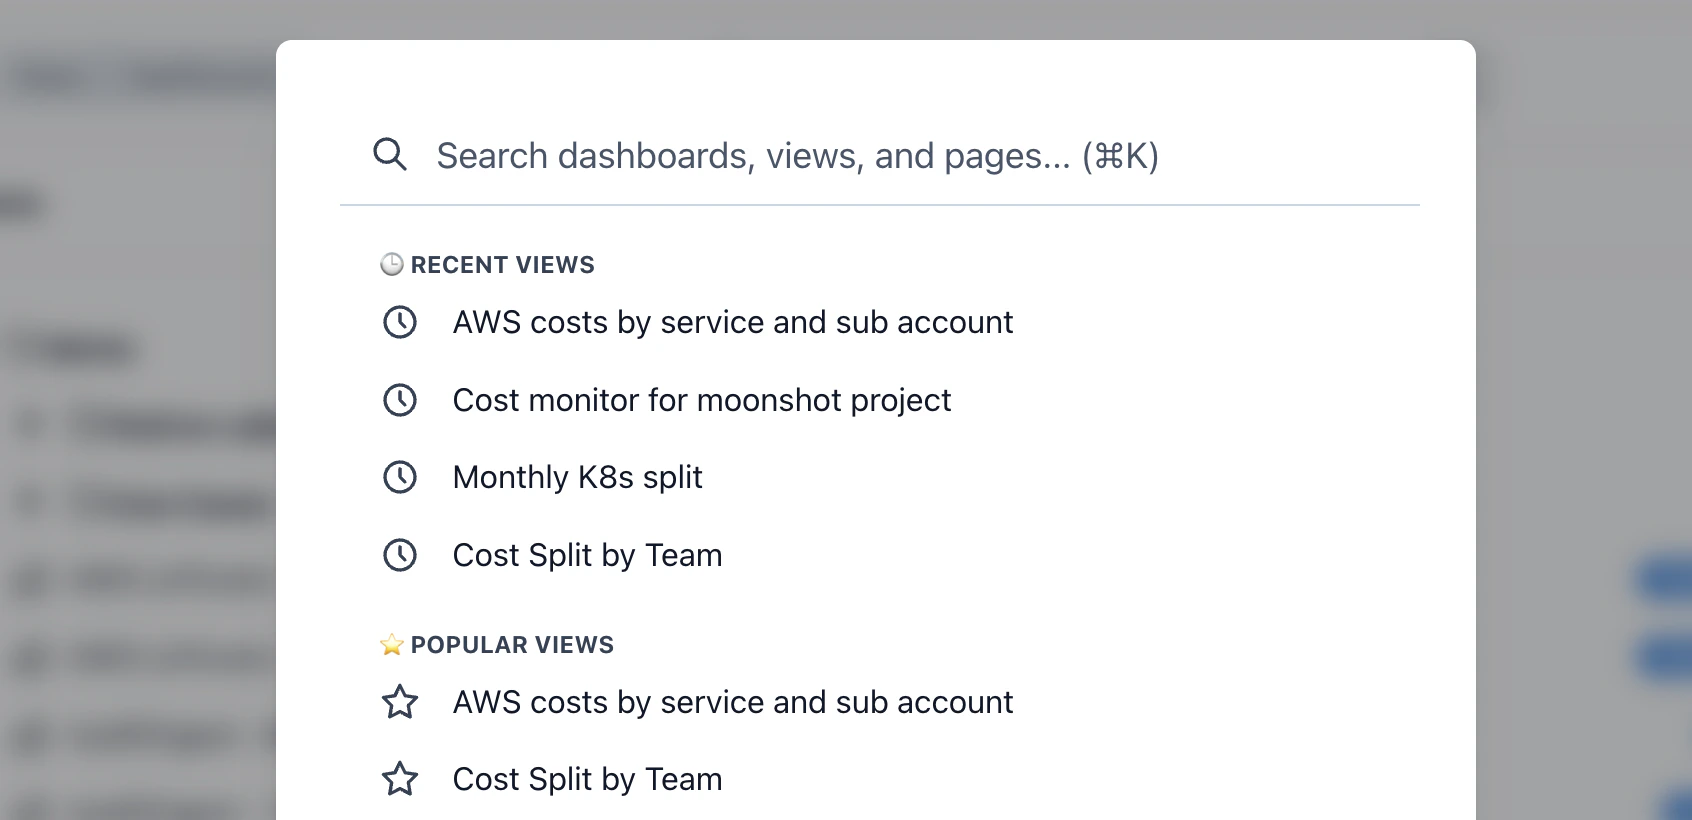
Meet Costory Spotlight
Press Cmd/Ctrl+K from anywhere to open Spotlight and navigate directly to your most-used views and features. Start typing to search across dashboards, saved views, metrics and more. Arrow keys navigate, Enter opens, Escape closes.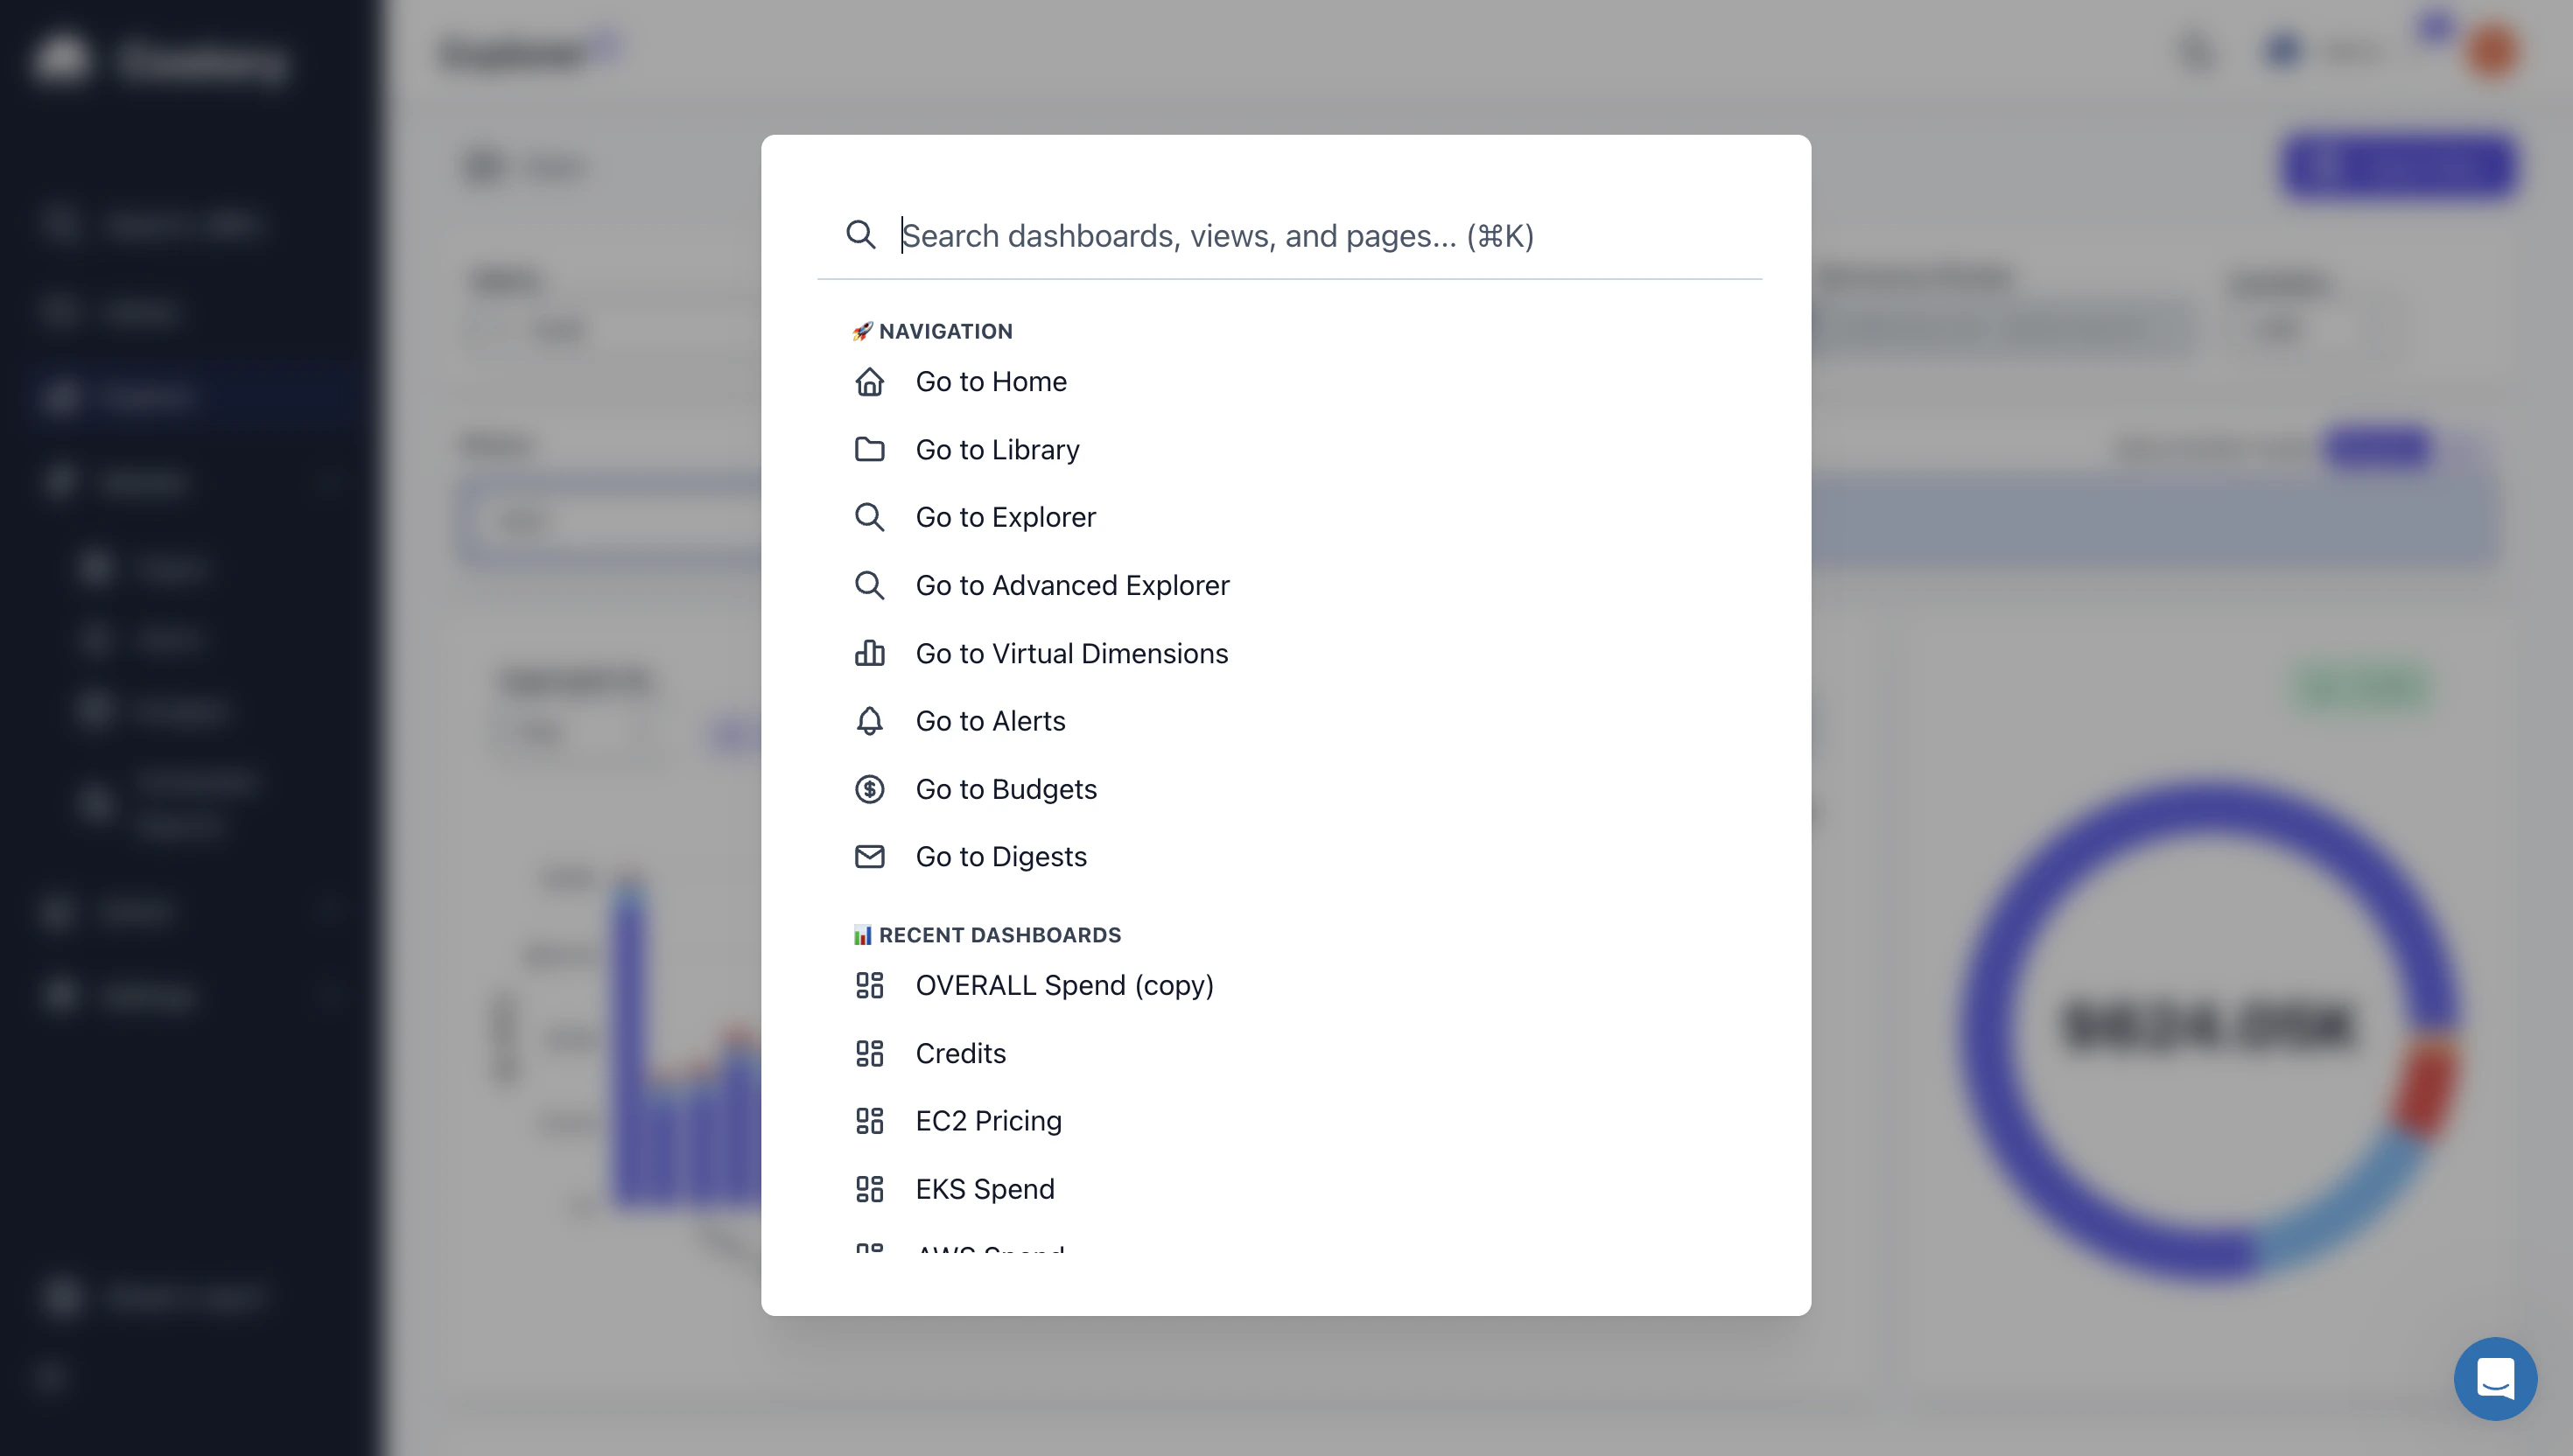
Dec 5 2025
Smarter Cost Analysis with Billy
Billy got a major upgrade to how it understands and navigates your cost data. Improved vocabulary and column-naming awareness means Billy now interprets dimensions, labels, and groupings more accurately — fewer false leads, more relevant breakdowns.Under the hood, heavy columns are now tokenized for faster processing, and a new prompt architecture gives Billy better guidance on when to drill deeper versus when to surface results. Combined with the group-by quality scoring introduced in November, Billy’s investigations are sharper and faster than ever.Nov 27 2025
Streamlined Onboarding
Organization creation is now fully automated during sign-up — no manual steps required. The onboarding flow also supports organization hierarchies for teams managing parent and child accounts, with smarter defaults and improved invite handling.Nov 20 2025
Multi-Org Support, Exports & Quality of Life
- Multi-organization support — manage multiple organizations from a single account and switch between them seamlessly
- Cleaner PNG exports — exports now match exactly what you see on screen, with proper borders and shadows
- Rename metrics without recreating them, and delete dashboards and views from anywhere
Nov 7 2025
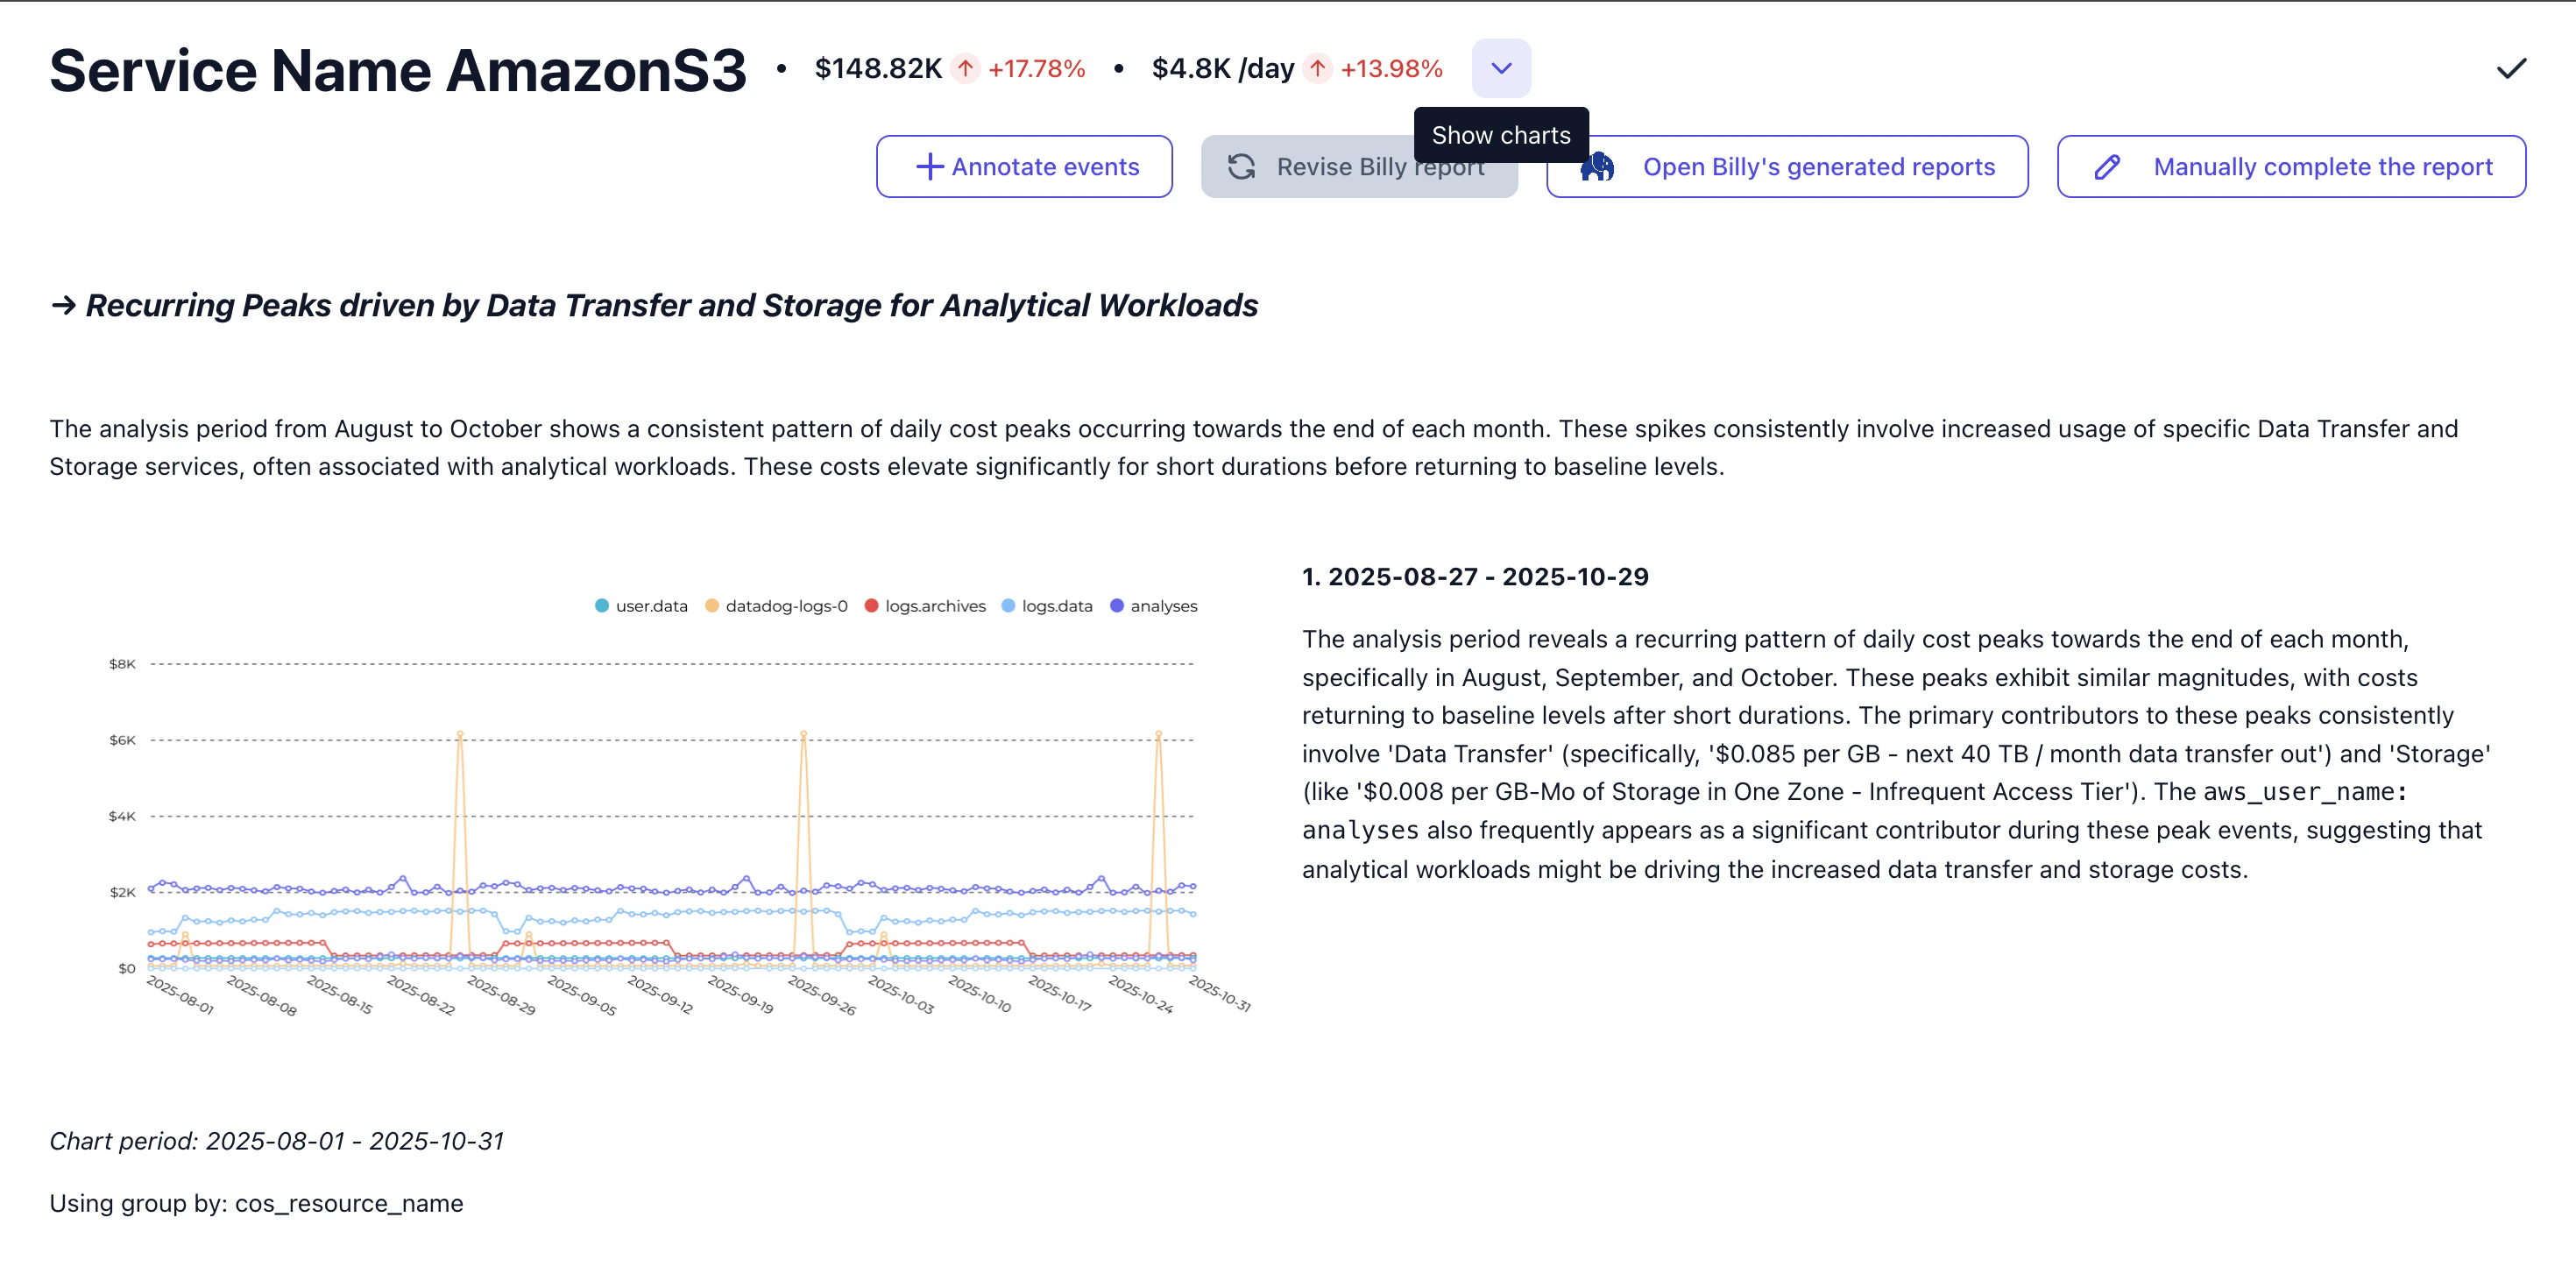
A New Look for Billy
Billy now generates full markdown for each node with dynamic chart generation. After identifying contributing factors for a cost spike, Billy picks the most relevant dimension to visualize the underlying cost drivers at a glance.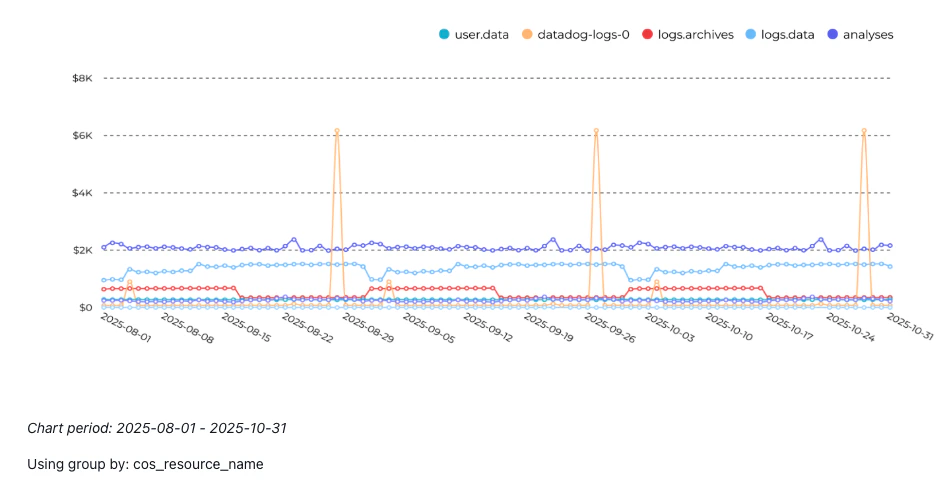

Nov 5 2025
Under the Hood: Billy Becomes an AI Agent
Billy evolved from a fixed analysis pipeline into an autonomous AI agent powered by Gemini. Instead of following predetermined steps, Billy now reasons about your data — deciding which dimensions to investigate, which statistical tests to run, and how to present findings.Key changes under the hood:- Tool-based architecture — Billy has its own toolbox: assess group-by quality, fetch timeseries, run contributing factor analysis, and pull historical cost context
- Statistical dimension selection — a concentration index scores each dimension before Billy drills in, so analysis focuses on what actually explains cost changes
- Parallel data fetching — timeseries queries now run concurrently, cutting investigation time significantly
- Events & knowledge retrieval — Billy can now pull events and organizational knowledge directly into its analysis, cross-referencing deployments, incidents, and internal context for richer explanations
Oct 30 2025
A New Look for the Explorer and Dashboards
The library is now keyboard-first — navigate everything with Cmd/Ctrl+K, arrow keys, and shortcuts. Consistent color schemes across all charts make it easier to track dimensions visually.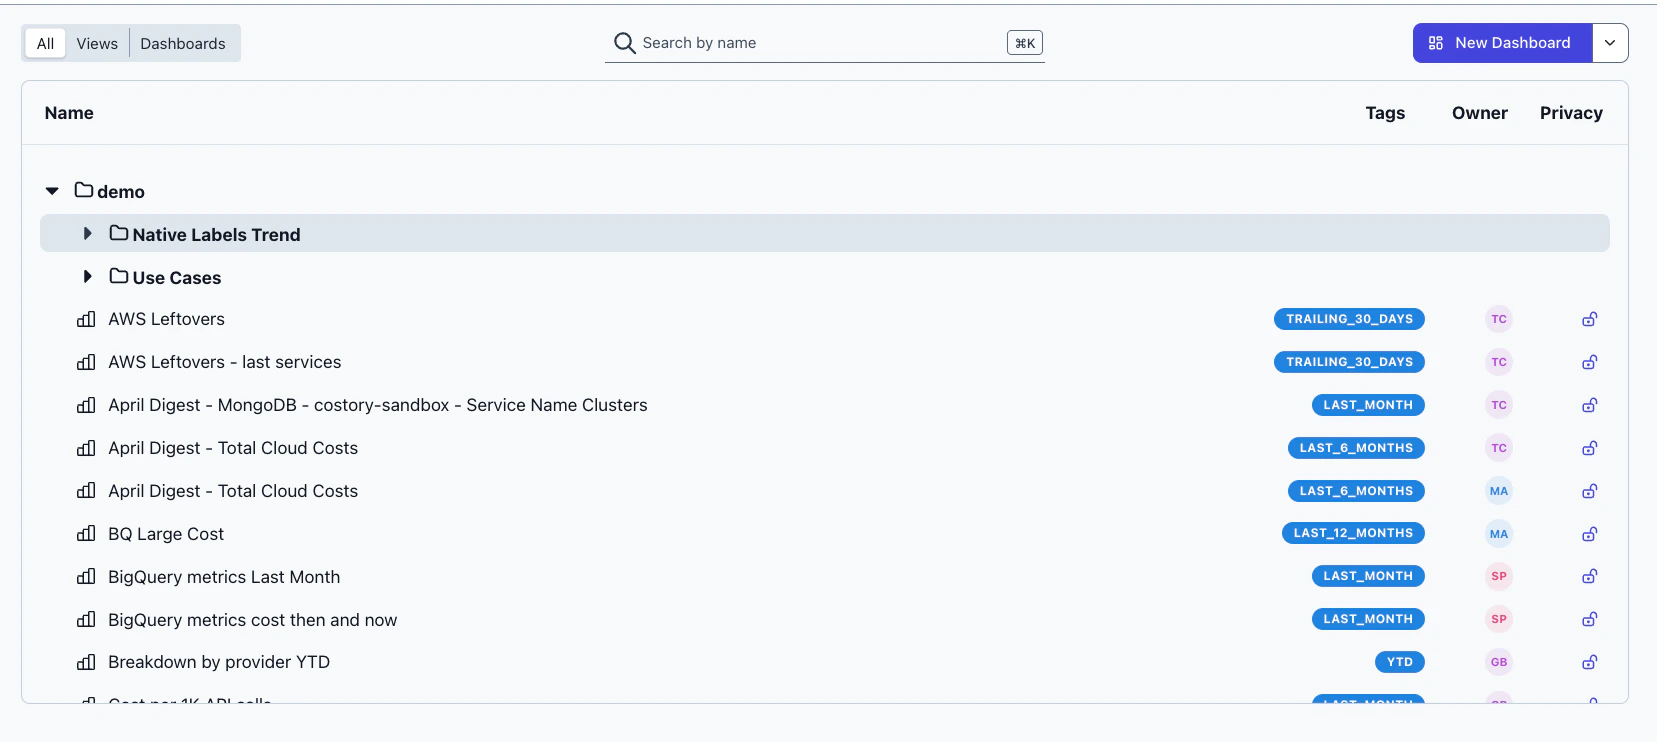
Oct 15 2025
Consistent Color Palette & Mobile Sign-Up
All charts now use a consistent color palette with full hex color support, making it easier to track dimensions visually across views and dashboards. The sign-up page is also now fully optimized for mobile.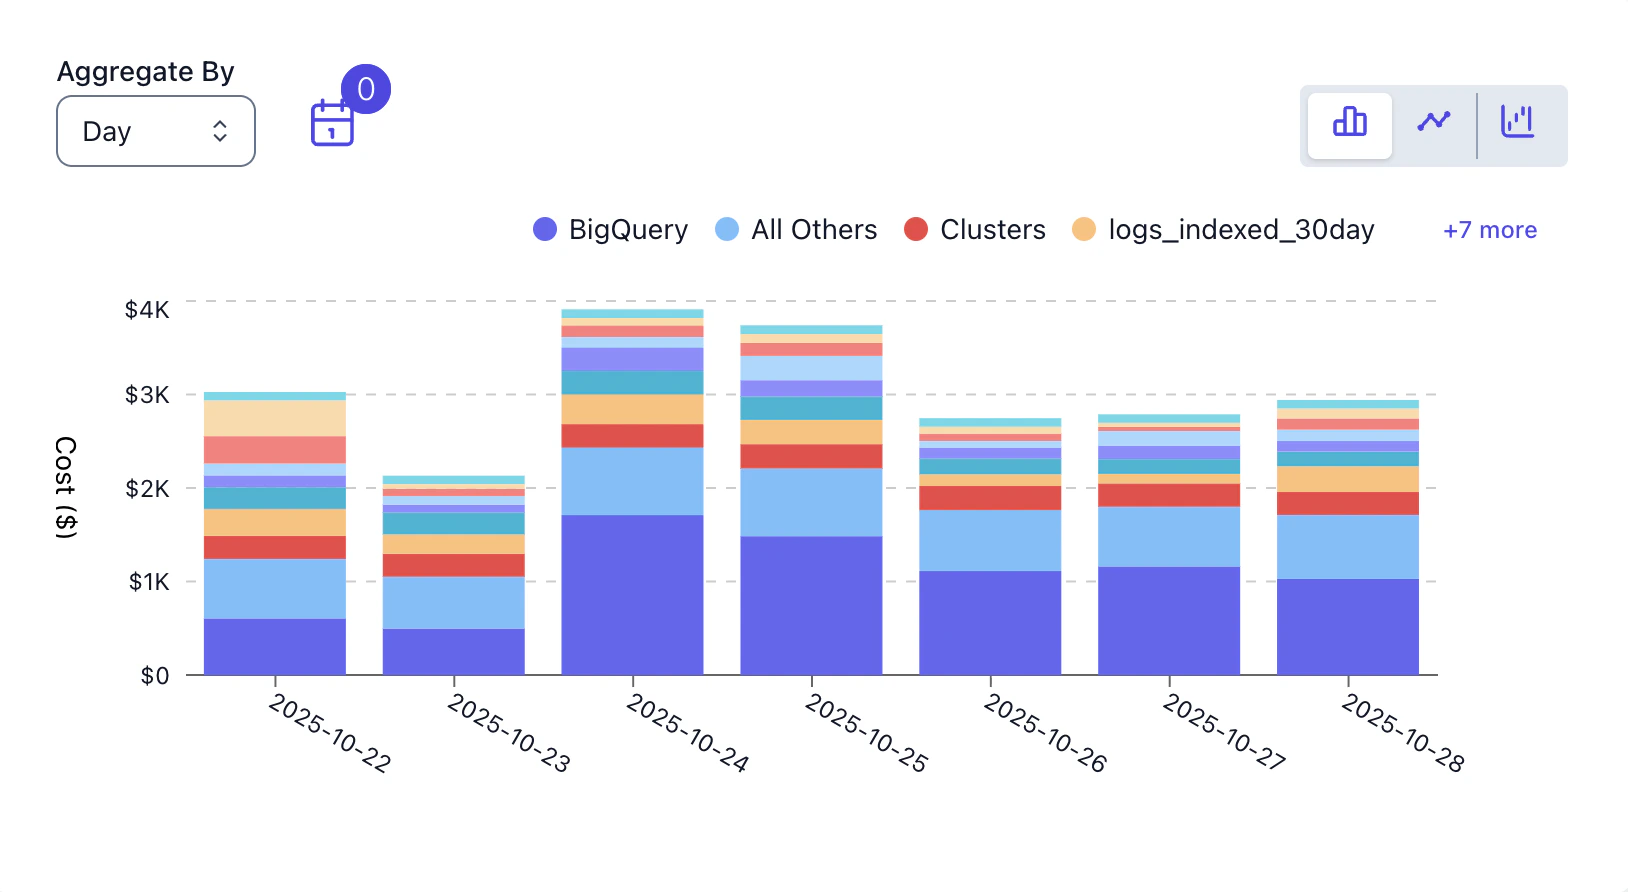
Oct 8 2025
Aiven Billing Integration
Track your Aiven managed service costs alongside other cloud providers. Billing data syncs automatically with full historical import.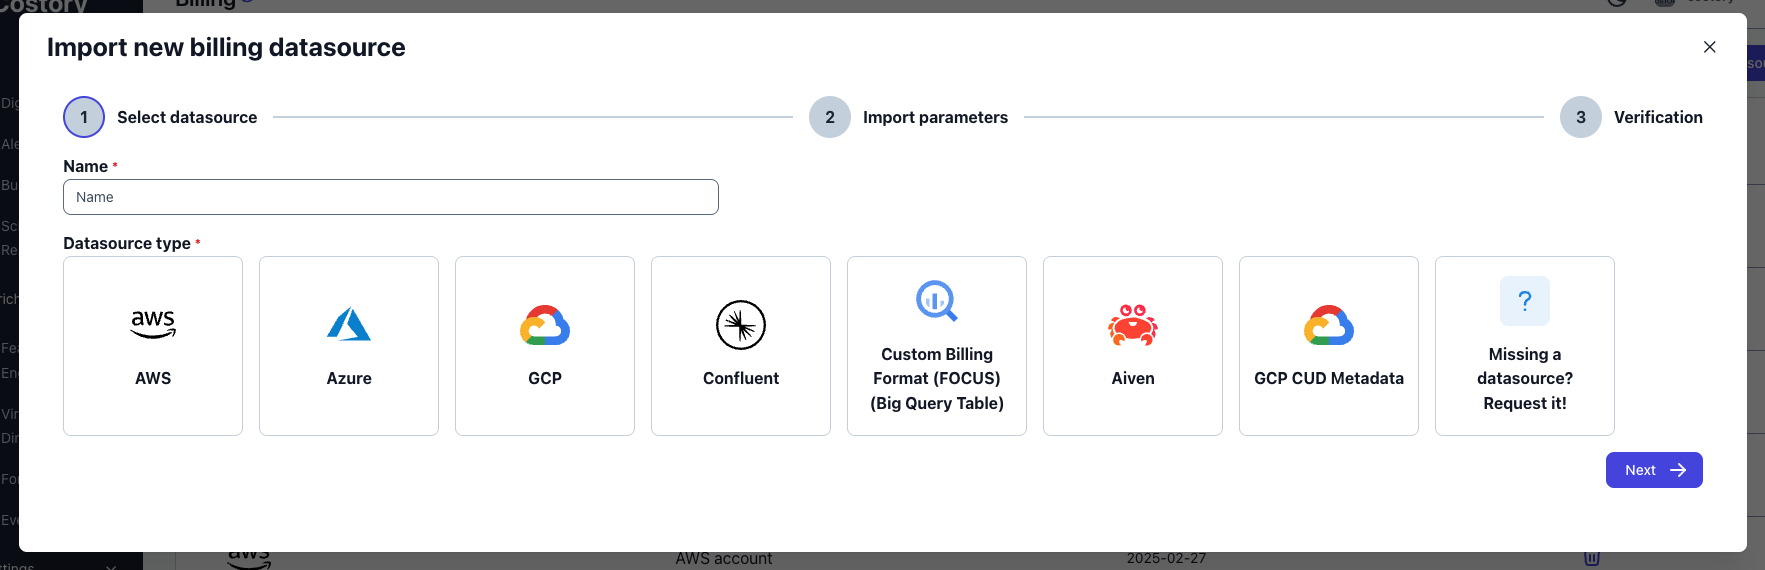
Oct 1 2025
Redesigned Onboarding & Sign-Up
A completely overhauled onboarding flow with automated organization creation, smarter defaults (start date now defaults to 3 months ago), and a redesigned sign-up page optimized for mobile. Setup wizards now link directly to the relevant documentation.Sep 17 2025
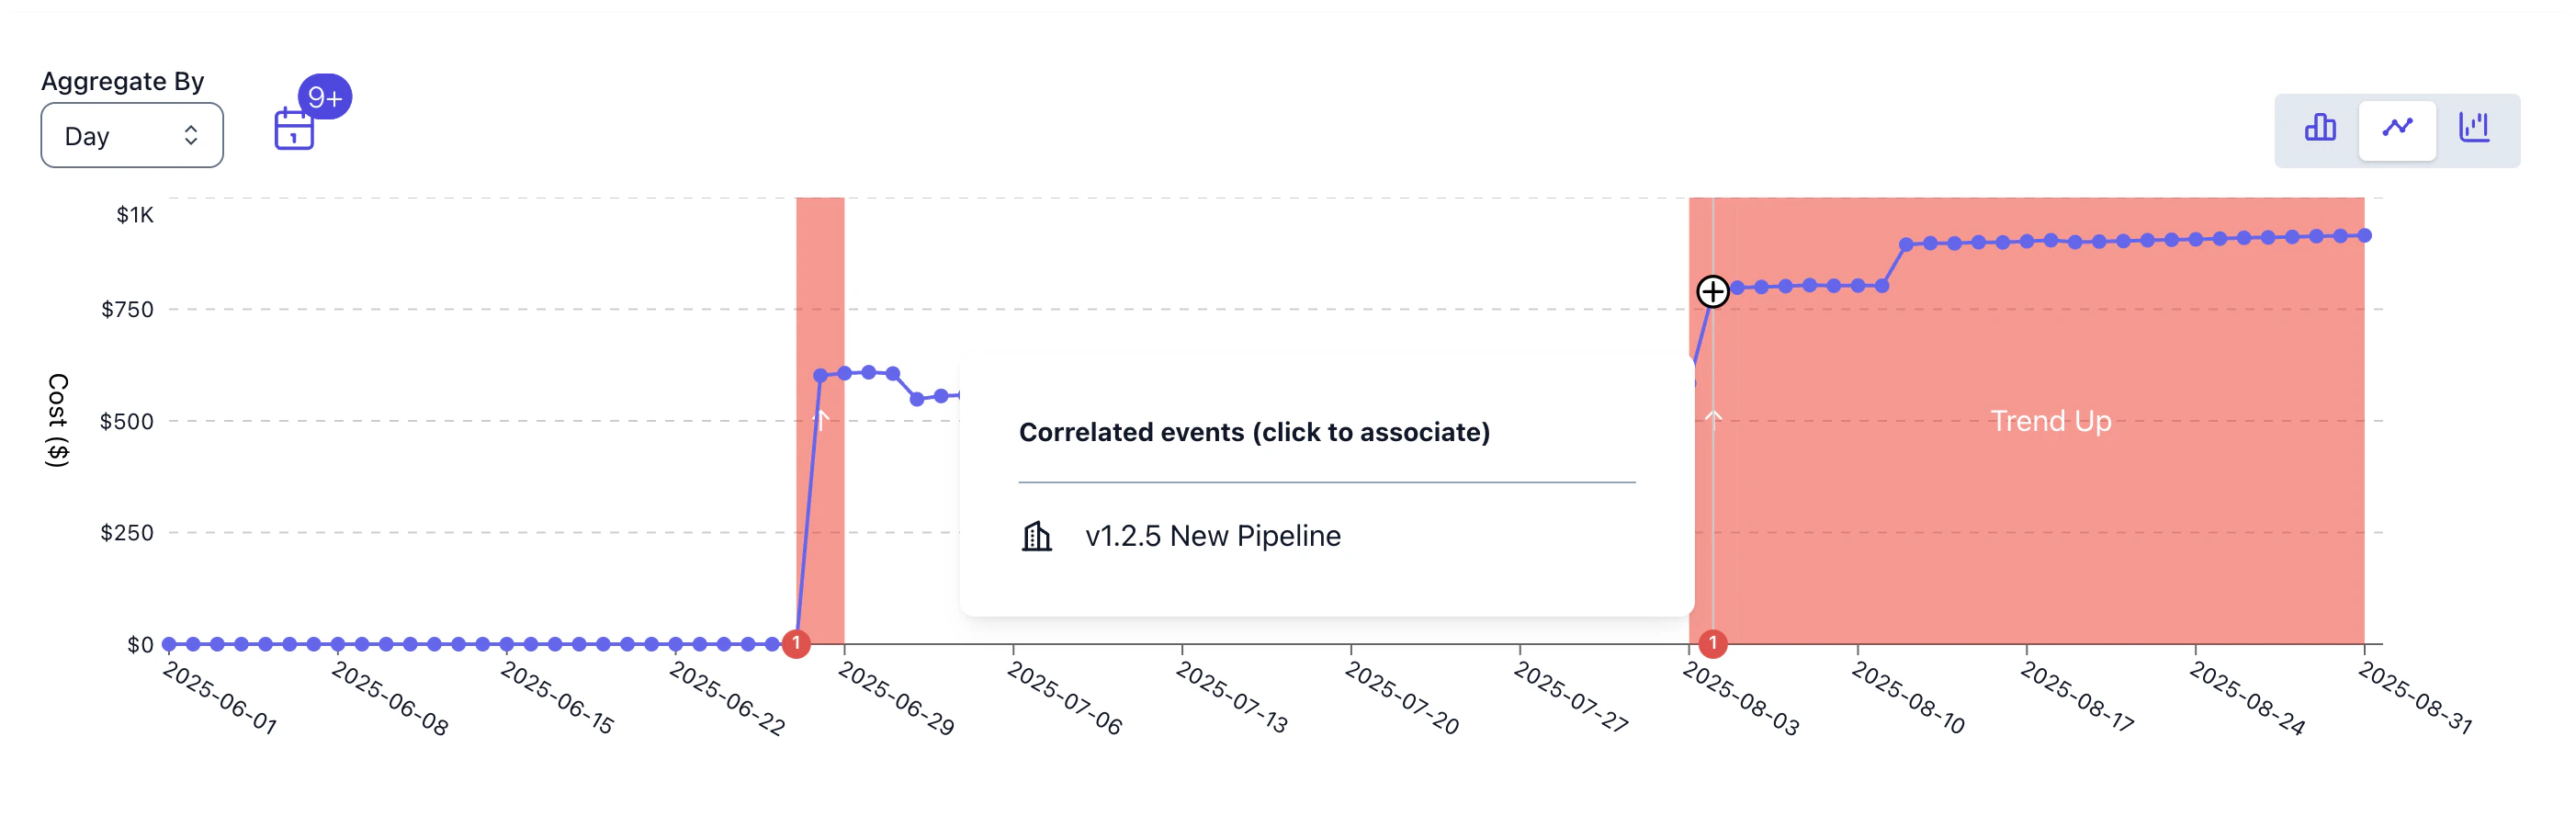
Event Correlations & Advanced Cost Metrics
Events Correlations in the Digest — correlated events now appear for every cost change and trend, helping you identify root causes and share findings with your organization.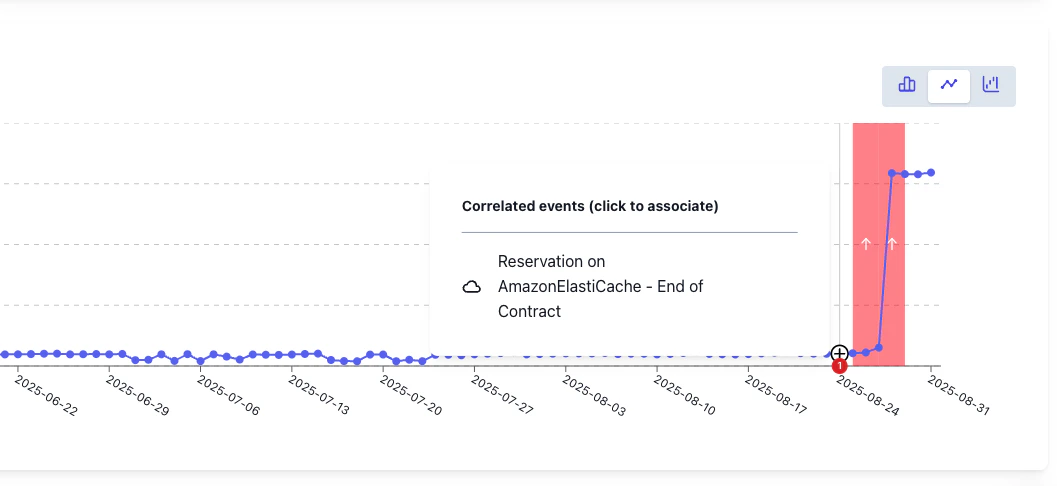
Sep 4 2025
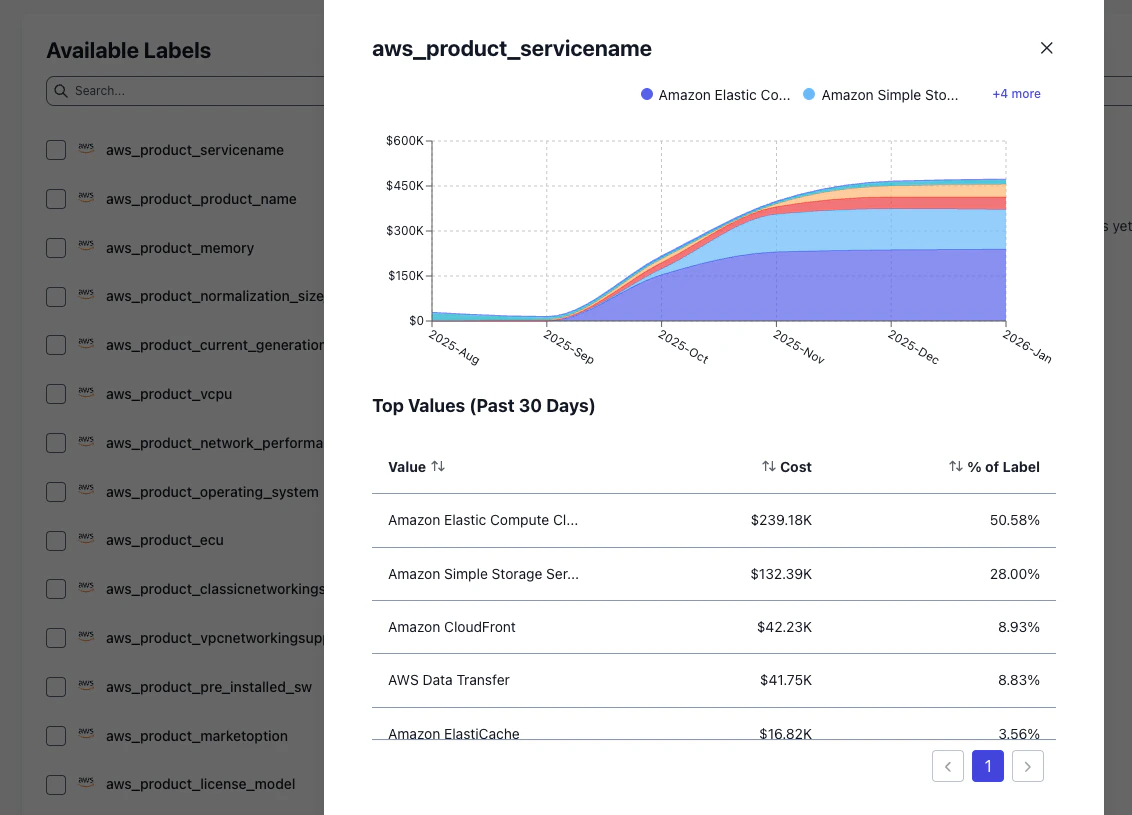
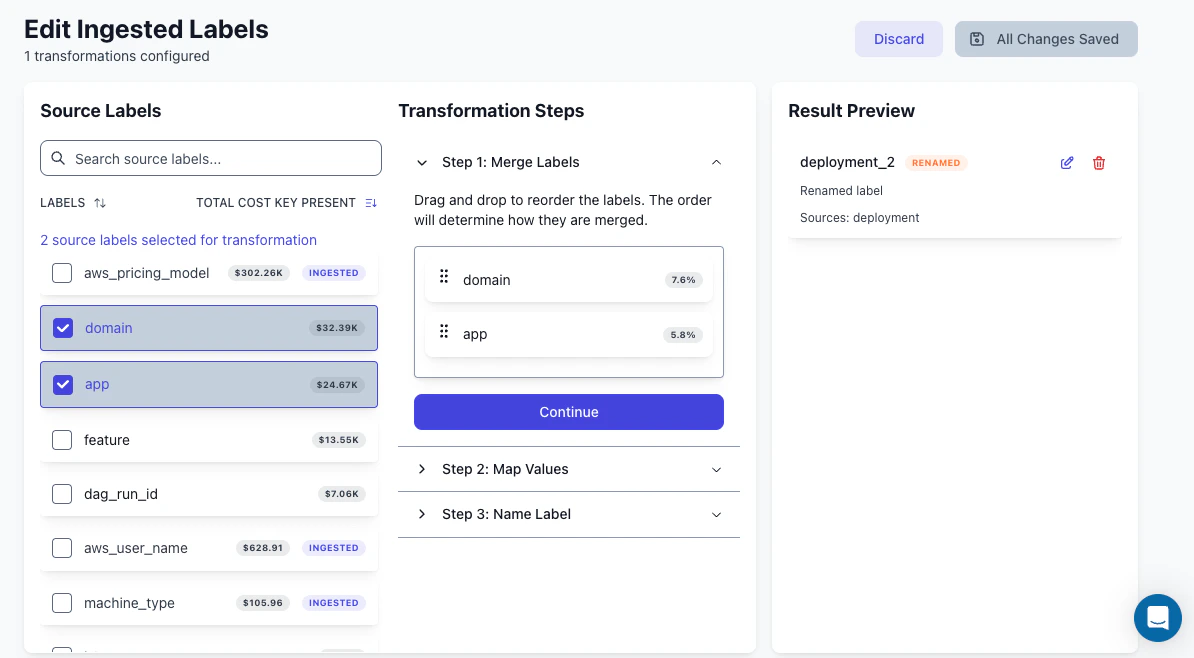
Dimensions in Labels Explorer
Introducing Dimensions in the Labels Explorer, a way to standardize and transform cost labels across all cloud providers.- Select & Merge Labels: choose multiple labels from different sources and merge them into a single, unified label
- Map Values: standardize disparate values (e.g., map “prod”, “production”, “prd” all to “Production”)
- Name & Save: give your new label a clear name and save it for use across all analyses
Aug 29 2025
Trends Detection & New Charts
Billy now analyzes your spending and overlays trends directly on charts, helping you distinguish signal from noise. In digests, trend charts with event markers let you correlate changes with deployments, incidents, or infrastructure updates.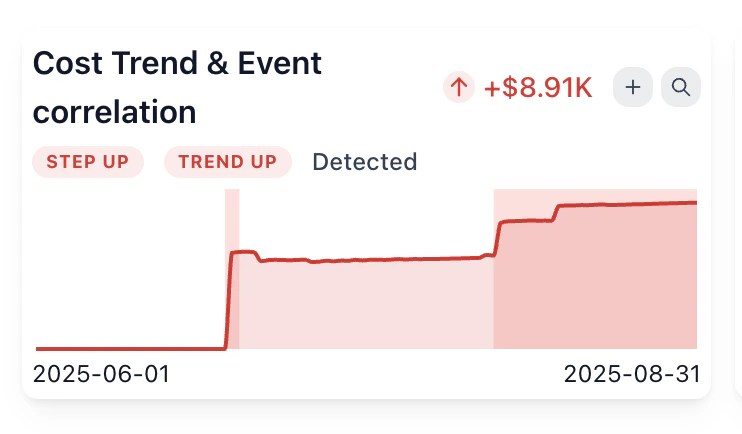
Aug 5 2025
Digests Redesigned
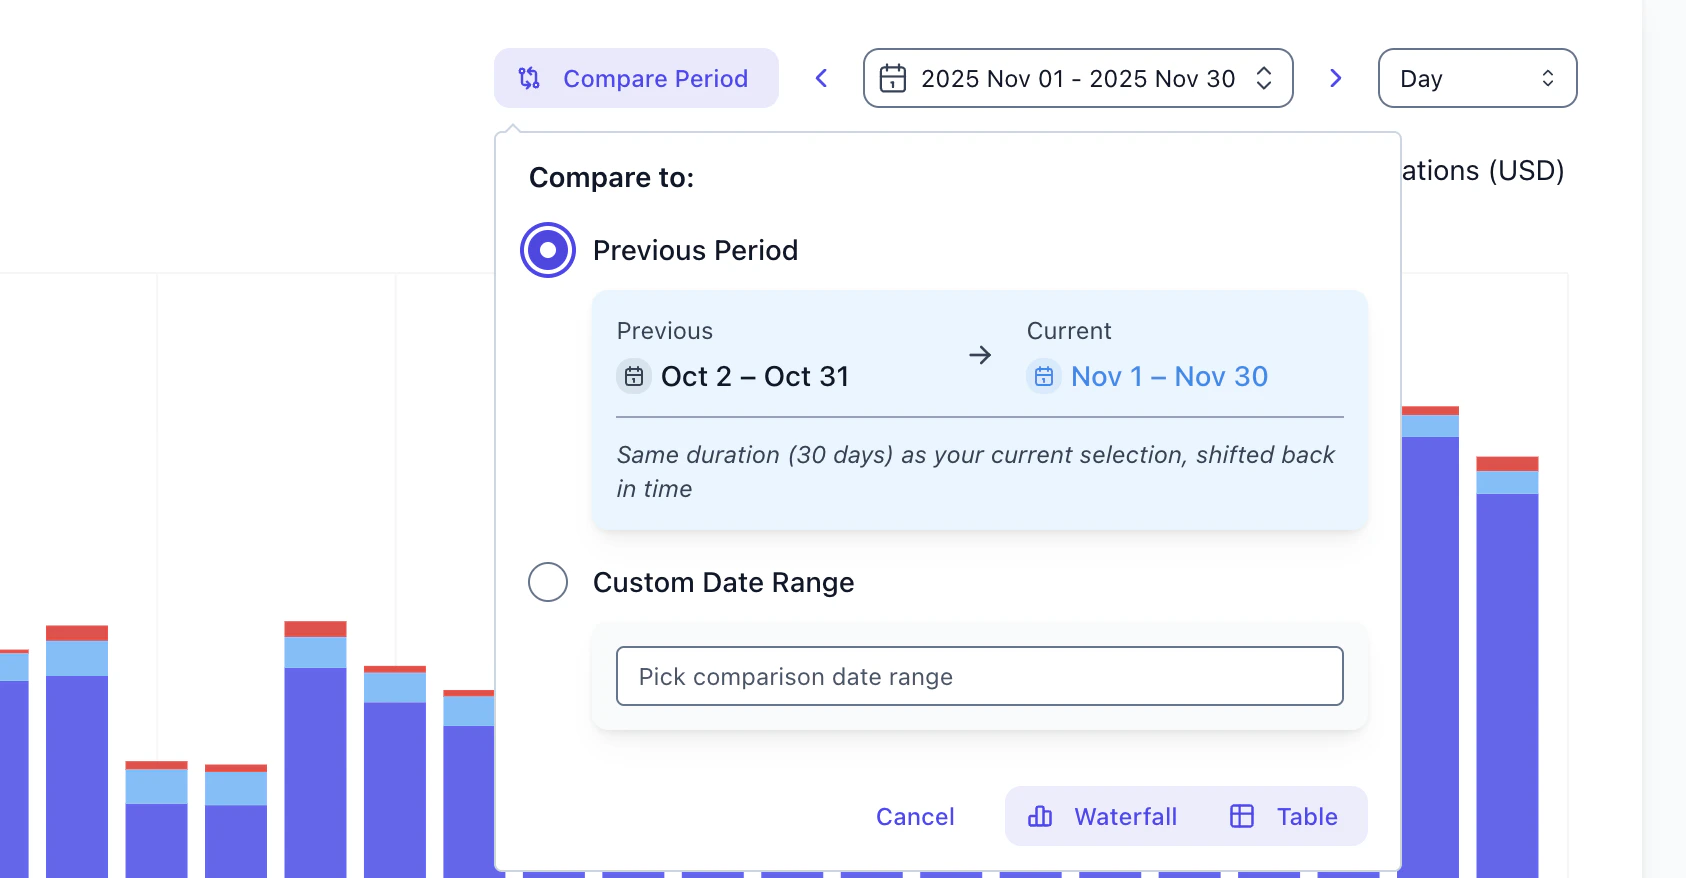
Digests redesigned from the ground up — a cleaner modal with badge-based organization. Collapse and expand sections as you review, with “Expand All” / “Collapse All” for quick navigation. Compare periods side by side with current month in solid blue and previous in dashed gray, with percentage changes in tooltips.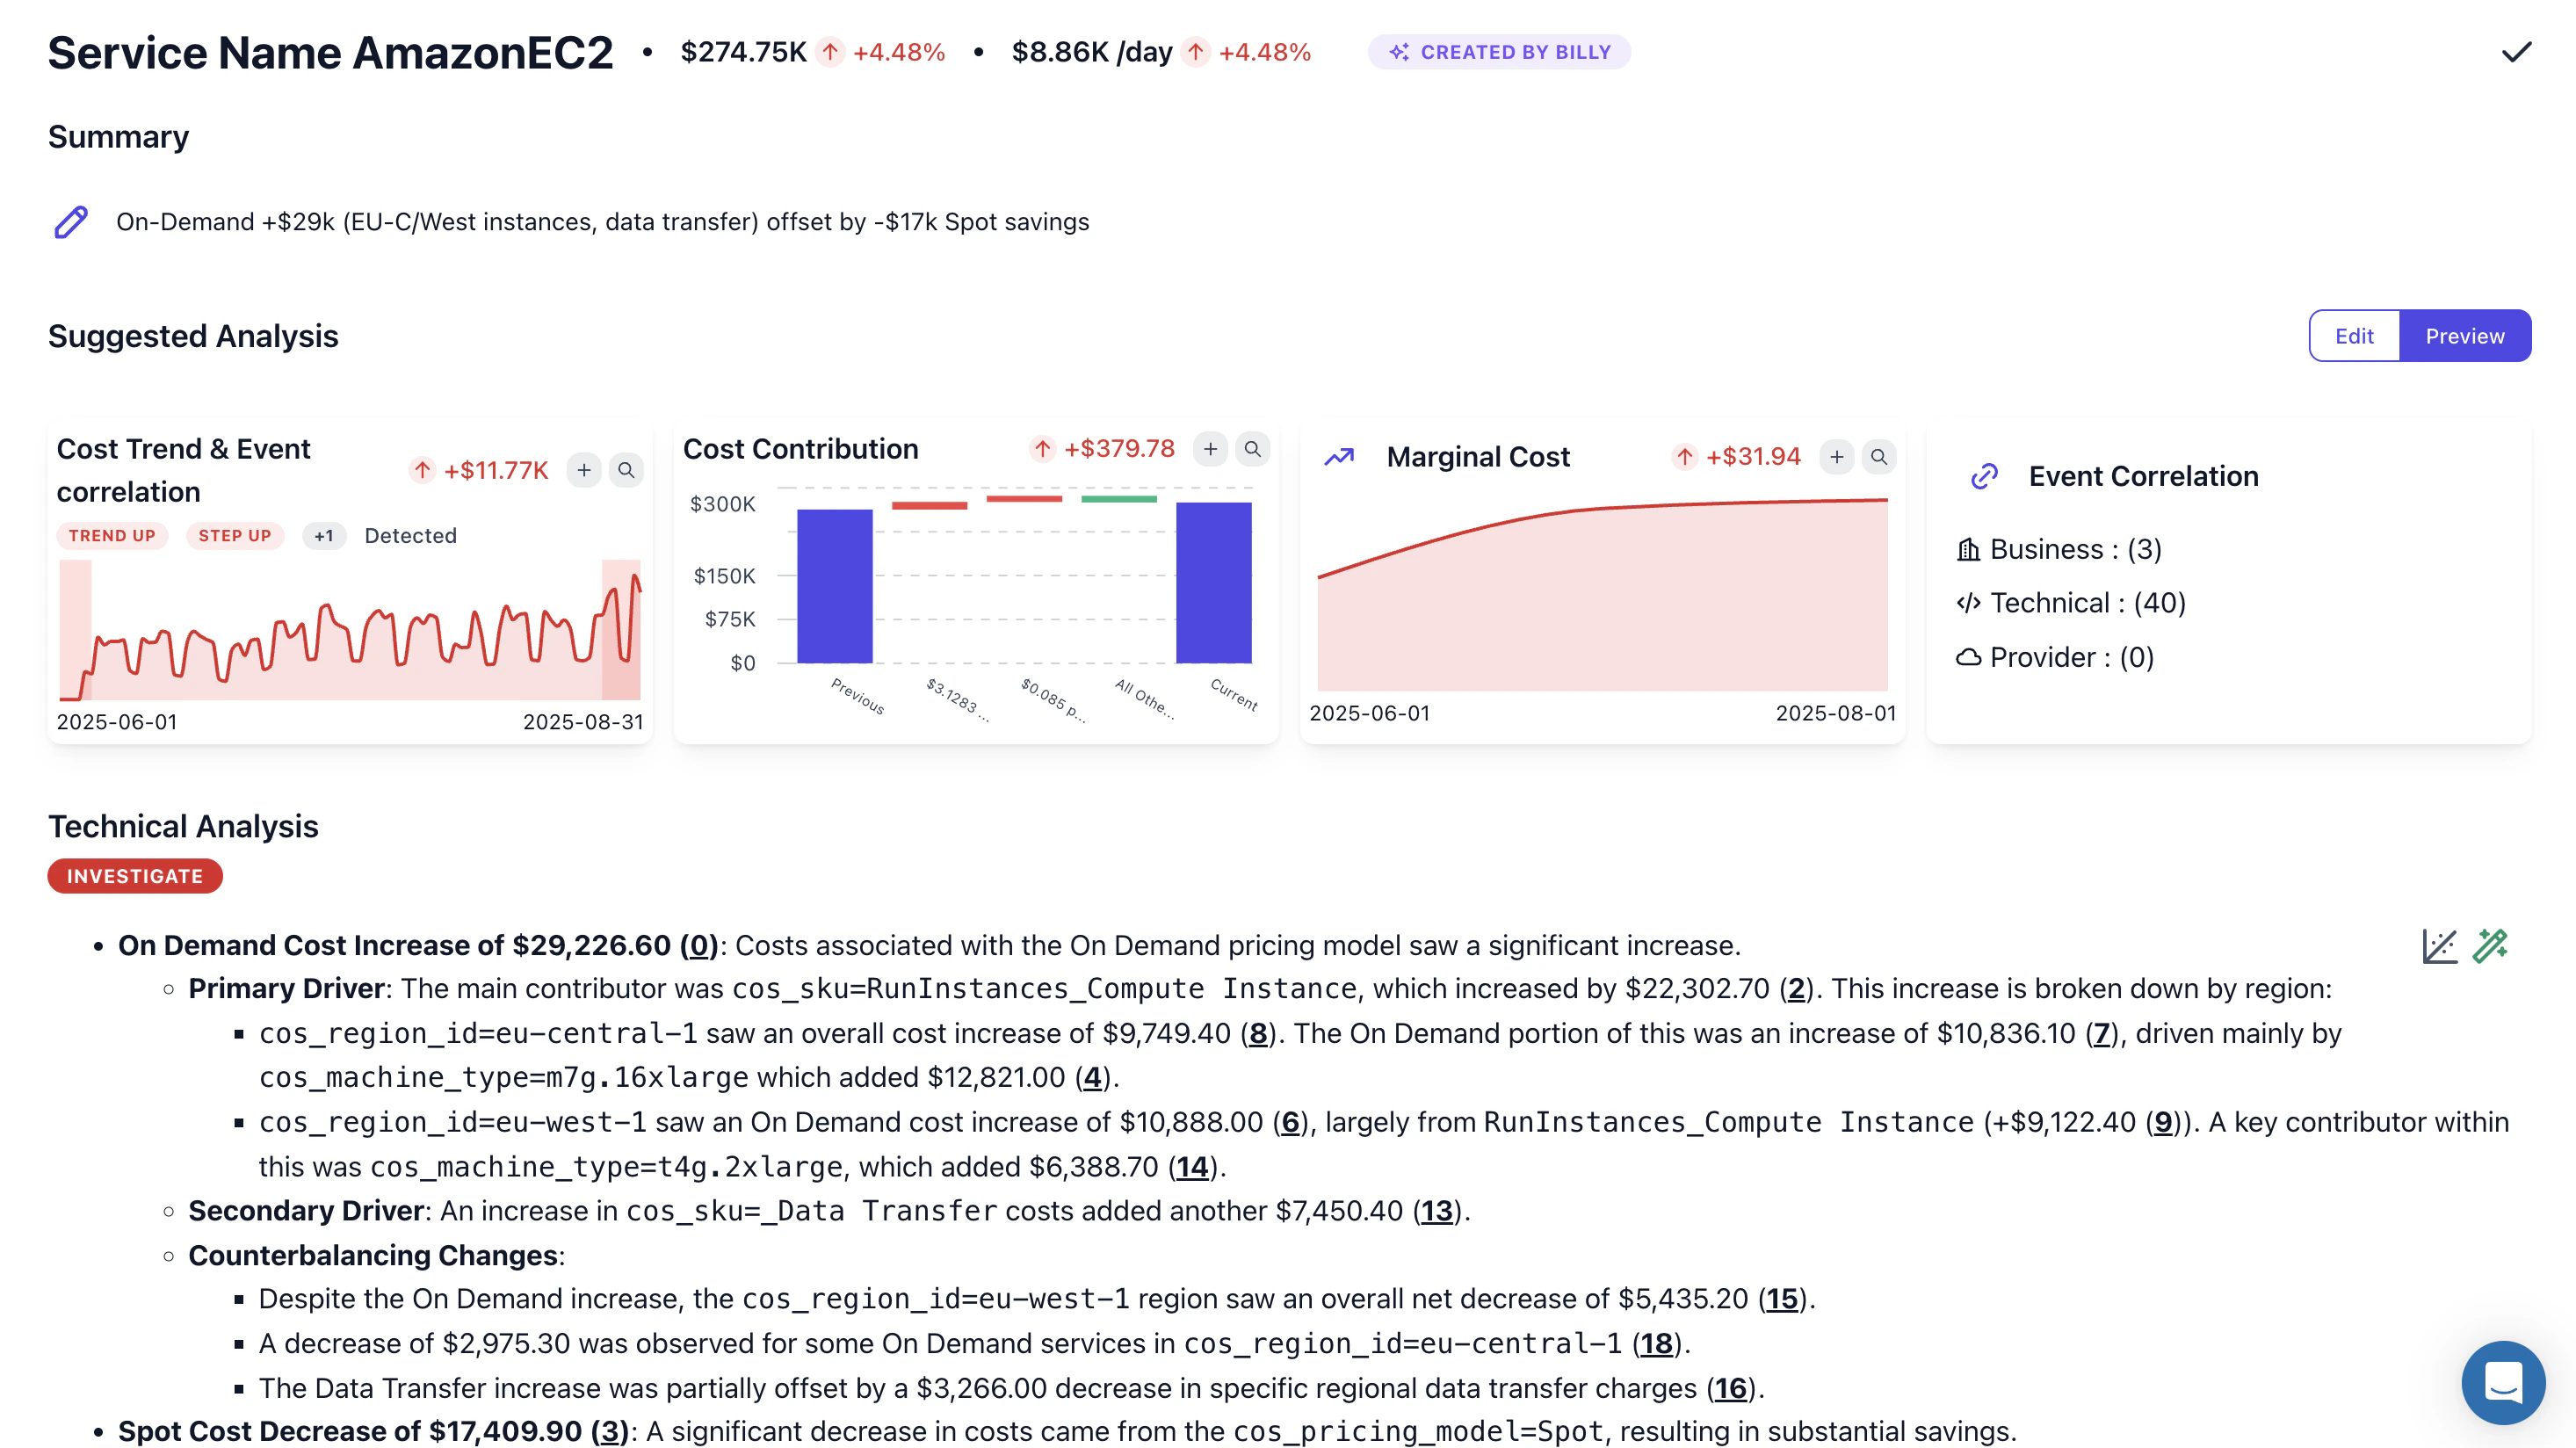
Jul 30 2025
Datadog Billing & Events in Saved Views
Datadog billing integration — track observability costs alongside cloud infrastructure with a setup wizard supporting both US and EU instances.Events in saved views — bookmark deployments, incidents, and releases to have them automatically appear on relevant dashboards. Event filters now save with your views.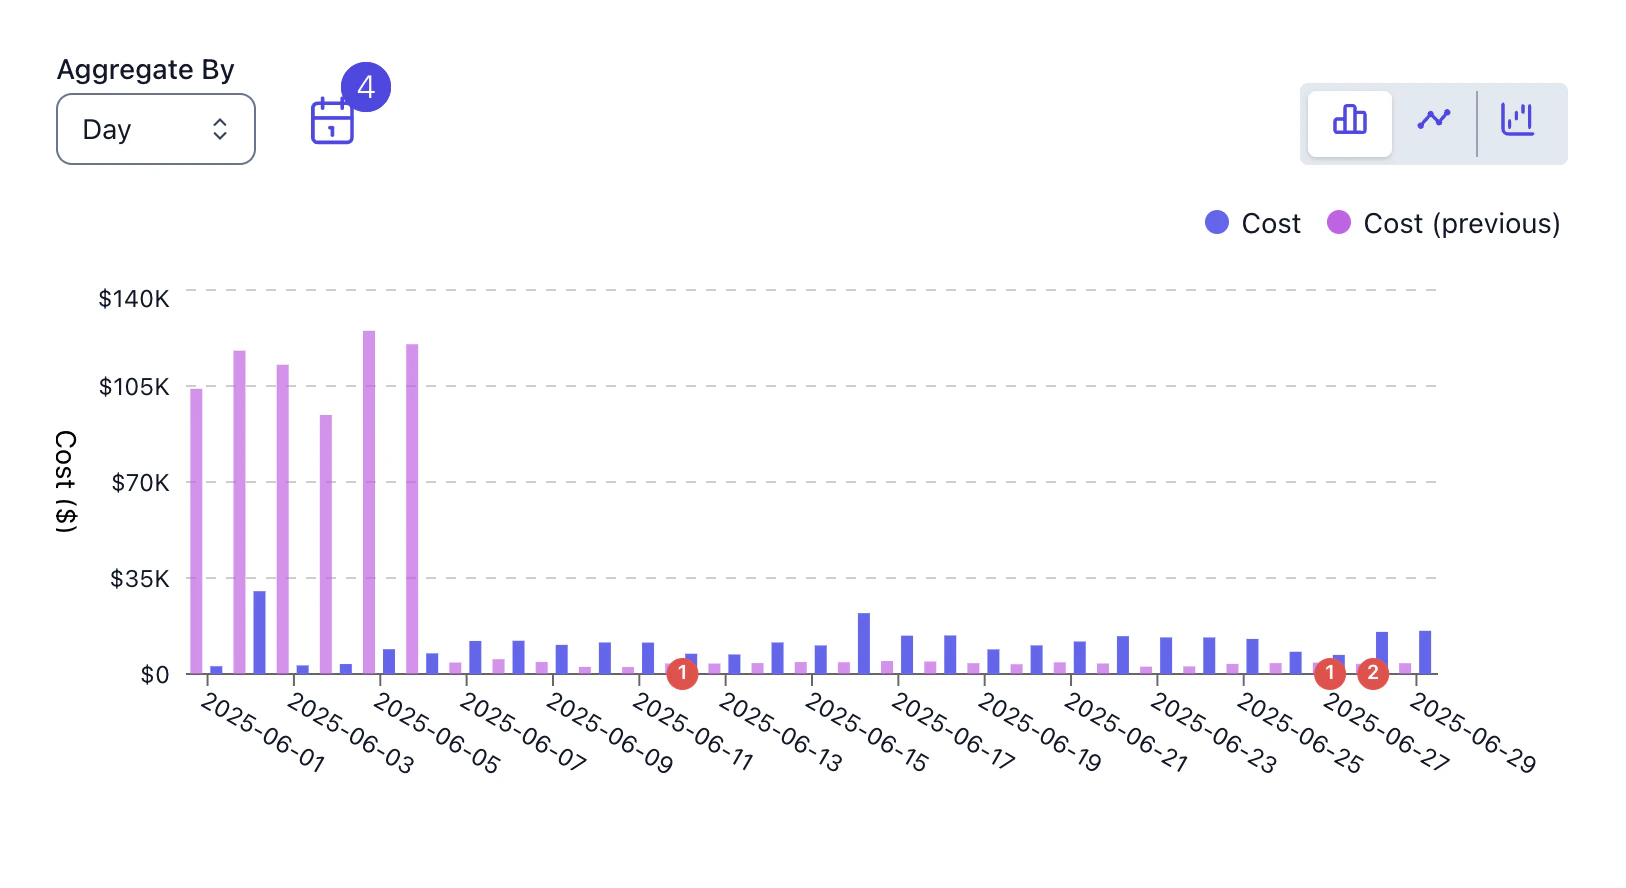
Jul 17 2025
Billy Investigates Your Cost Spikes
When Costory detects unusual spending, Billy automatically analyzes the spike and identifies contributing factors — within minutes. The analysis appears directly in your digest and respects your exclusion filters, so you only see what matters.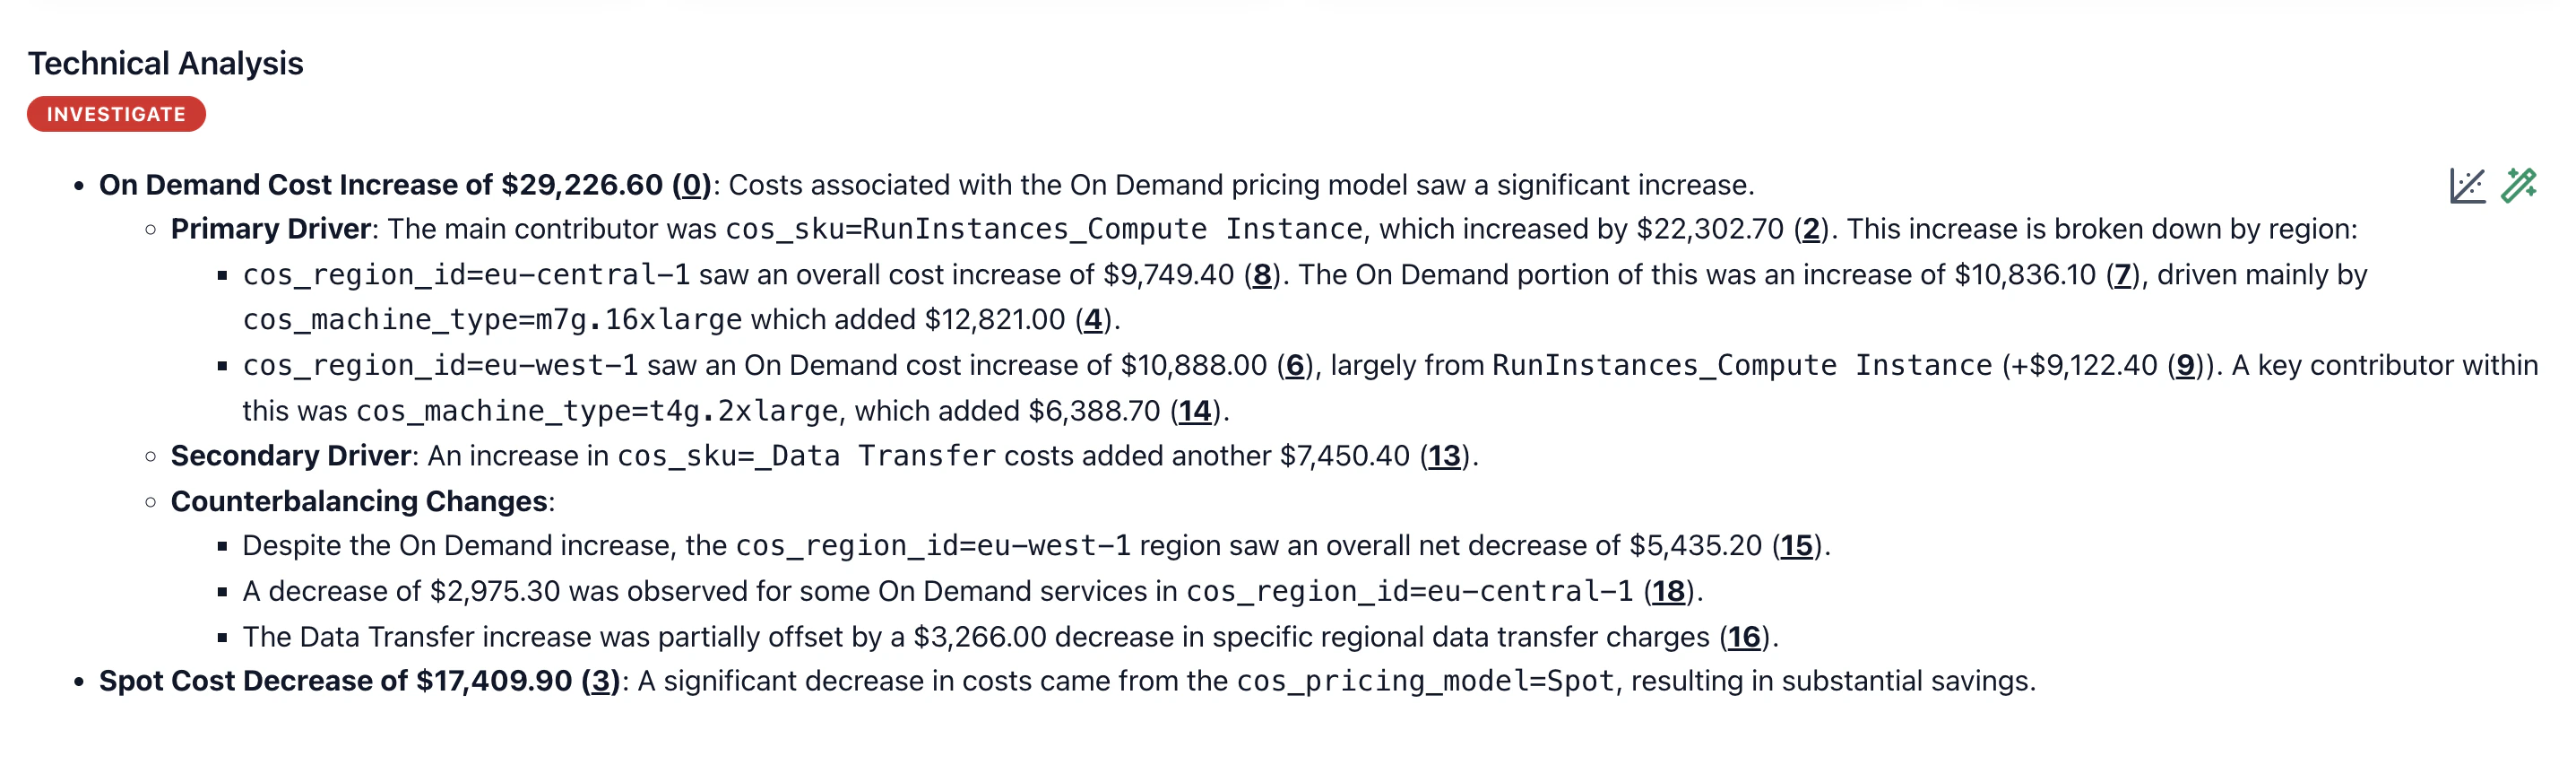
Jun 26 2025
Modern Group By & Events from Anywhere
The redesigned group by widget uses color-coded pills for different dimension categories (Infrastructure, Applications, etc.). Search finds dimensions by their actual values, not just names — searching “prod” finds dimensions containing “production” values. Full keyboard navigation makes exploration fast.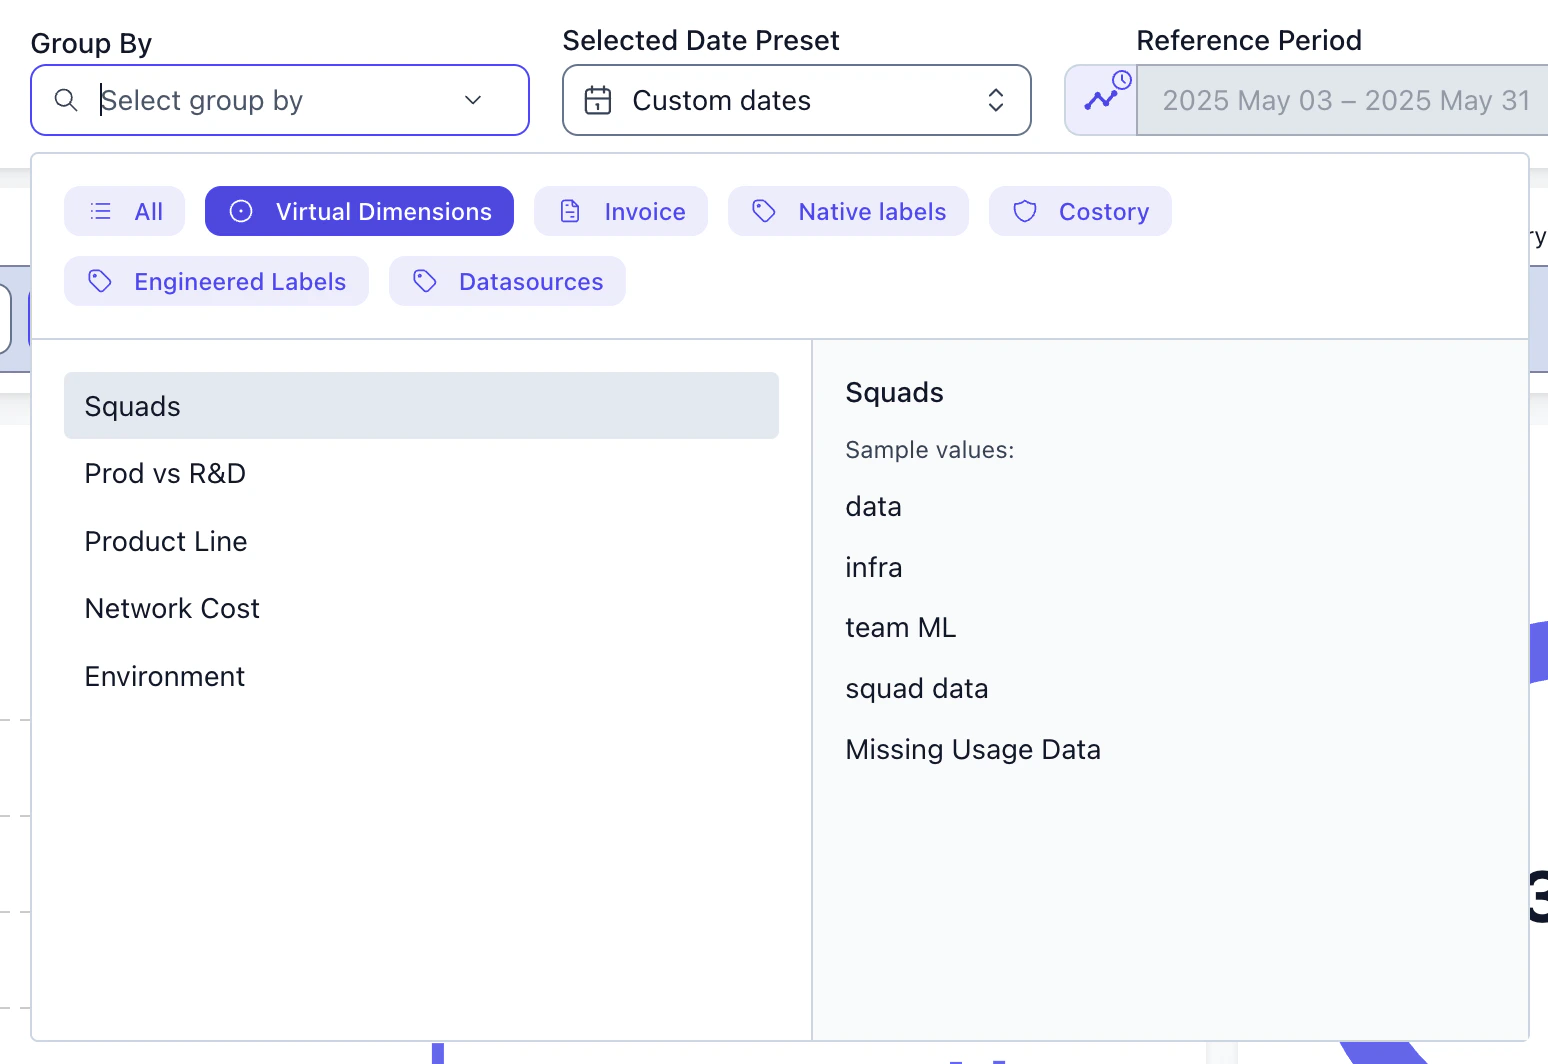
Jun 19 2025
AI Suggests the Dimensions That Matter
Billy now analyzes your data and suggests the most relevant dimensions to group by. The suggested axes feature scores dimensions by impact, showing which ones have the highest explanatory power. A sparkle icon marks suggestions, and you can auto-select them for instant insights.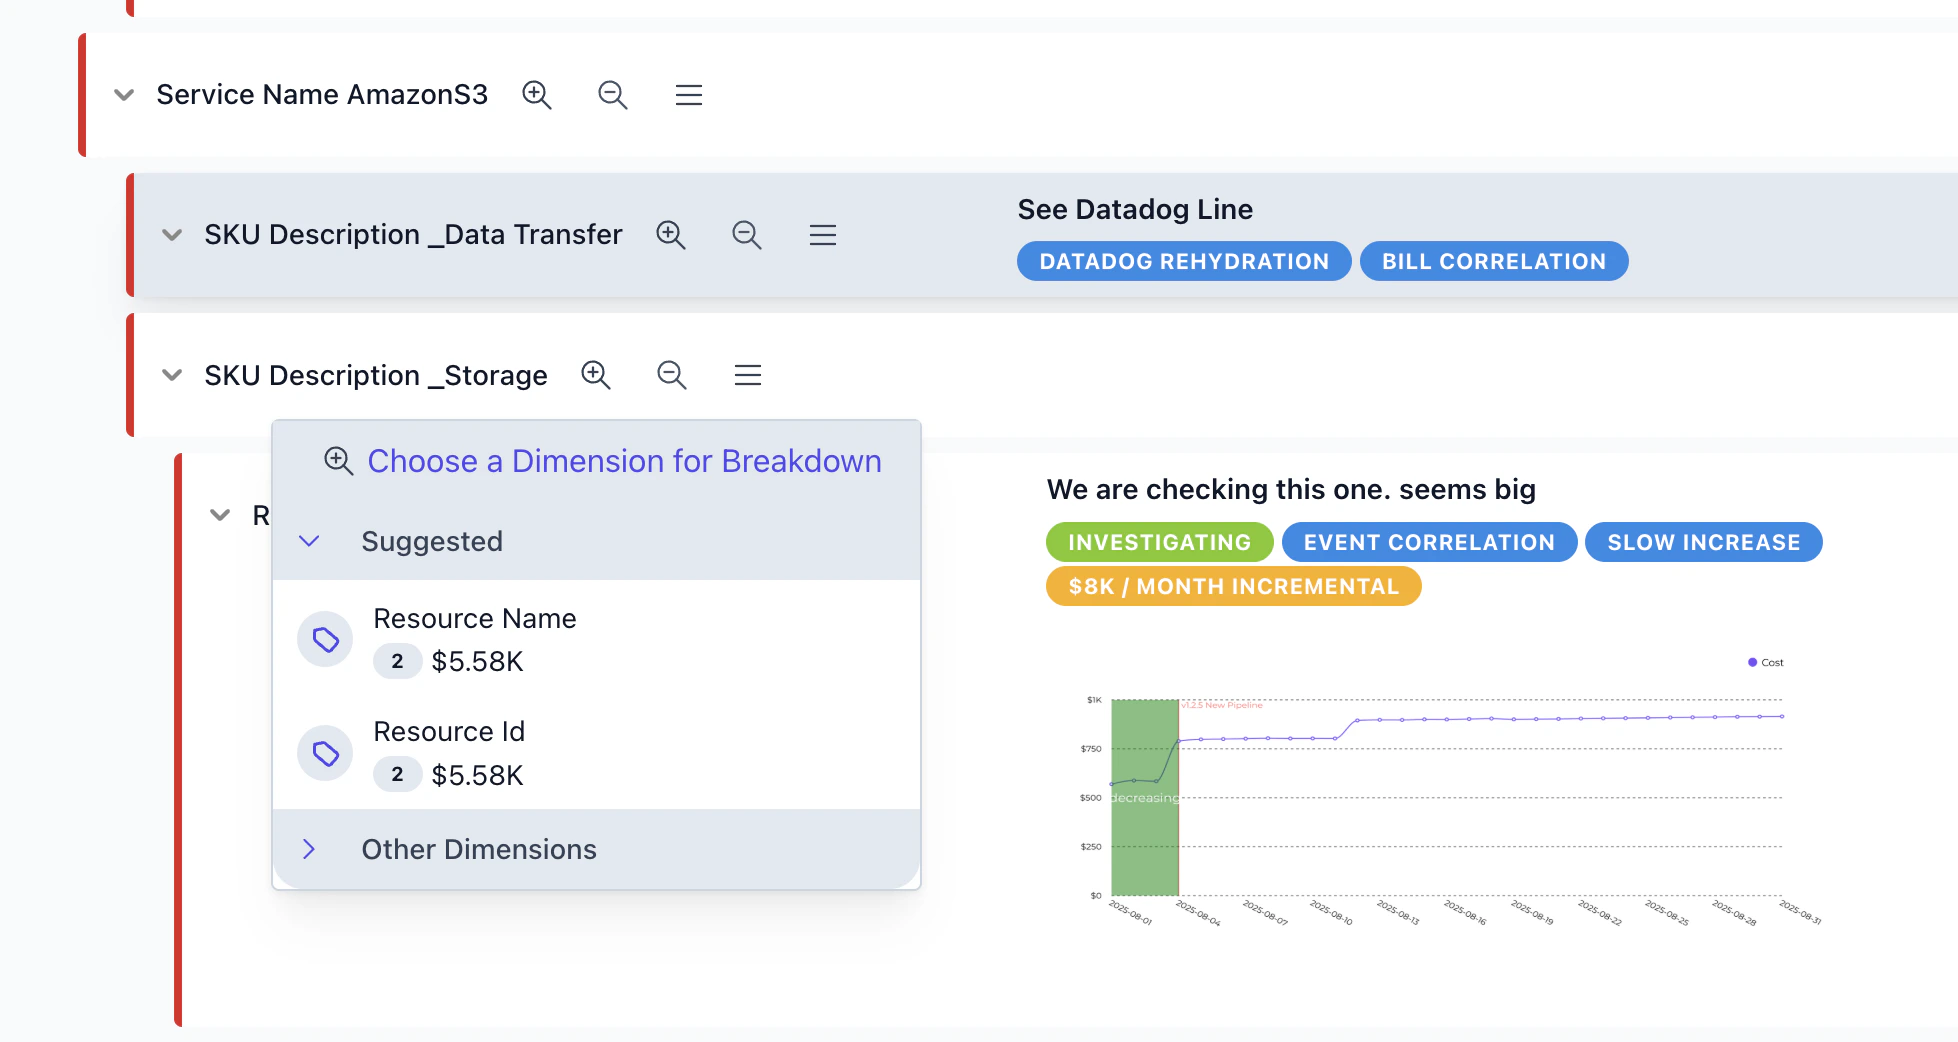
Jun 2 2025
Confluent Cloud, Split Costs & Integration Improvements
Confluent Cloud billing with automated BigQuery sync and historical data import. Datadog metrics got centralized configuration with faster previews. Custom BigQuery mappings now support 40+ fields.Split costs by actual usage — allocate shared costs based on telemetry from Datadog, CSV, Google Sheets, AWS, or CI visibility metrics. Map cost centers to usage metrics with visual previews showing top consumers over time.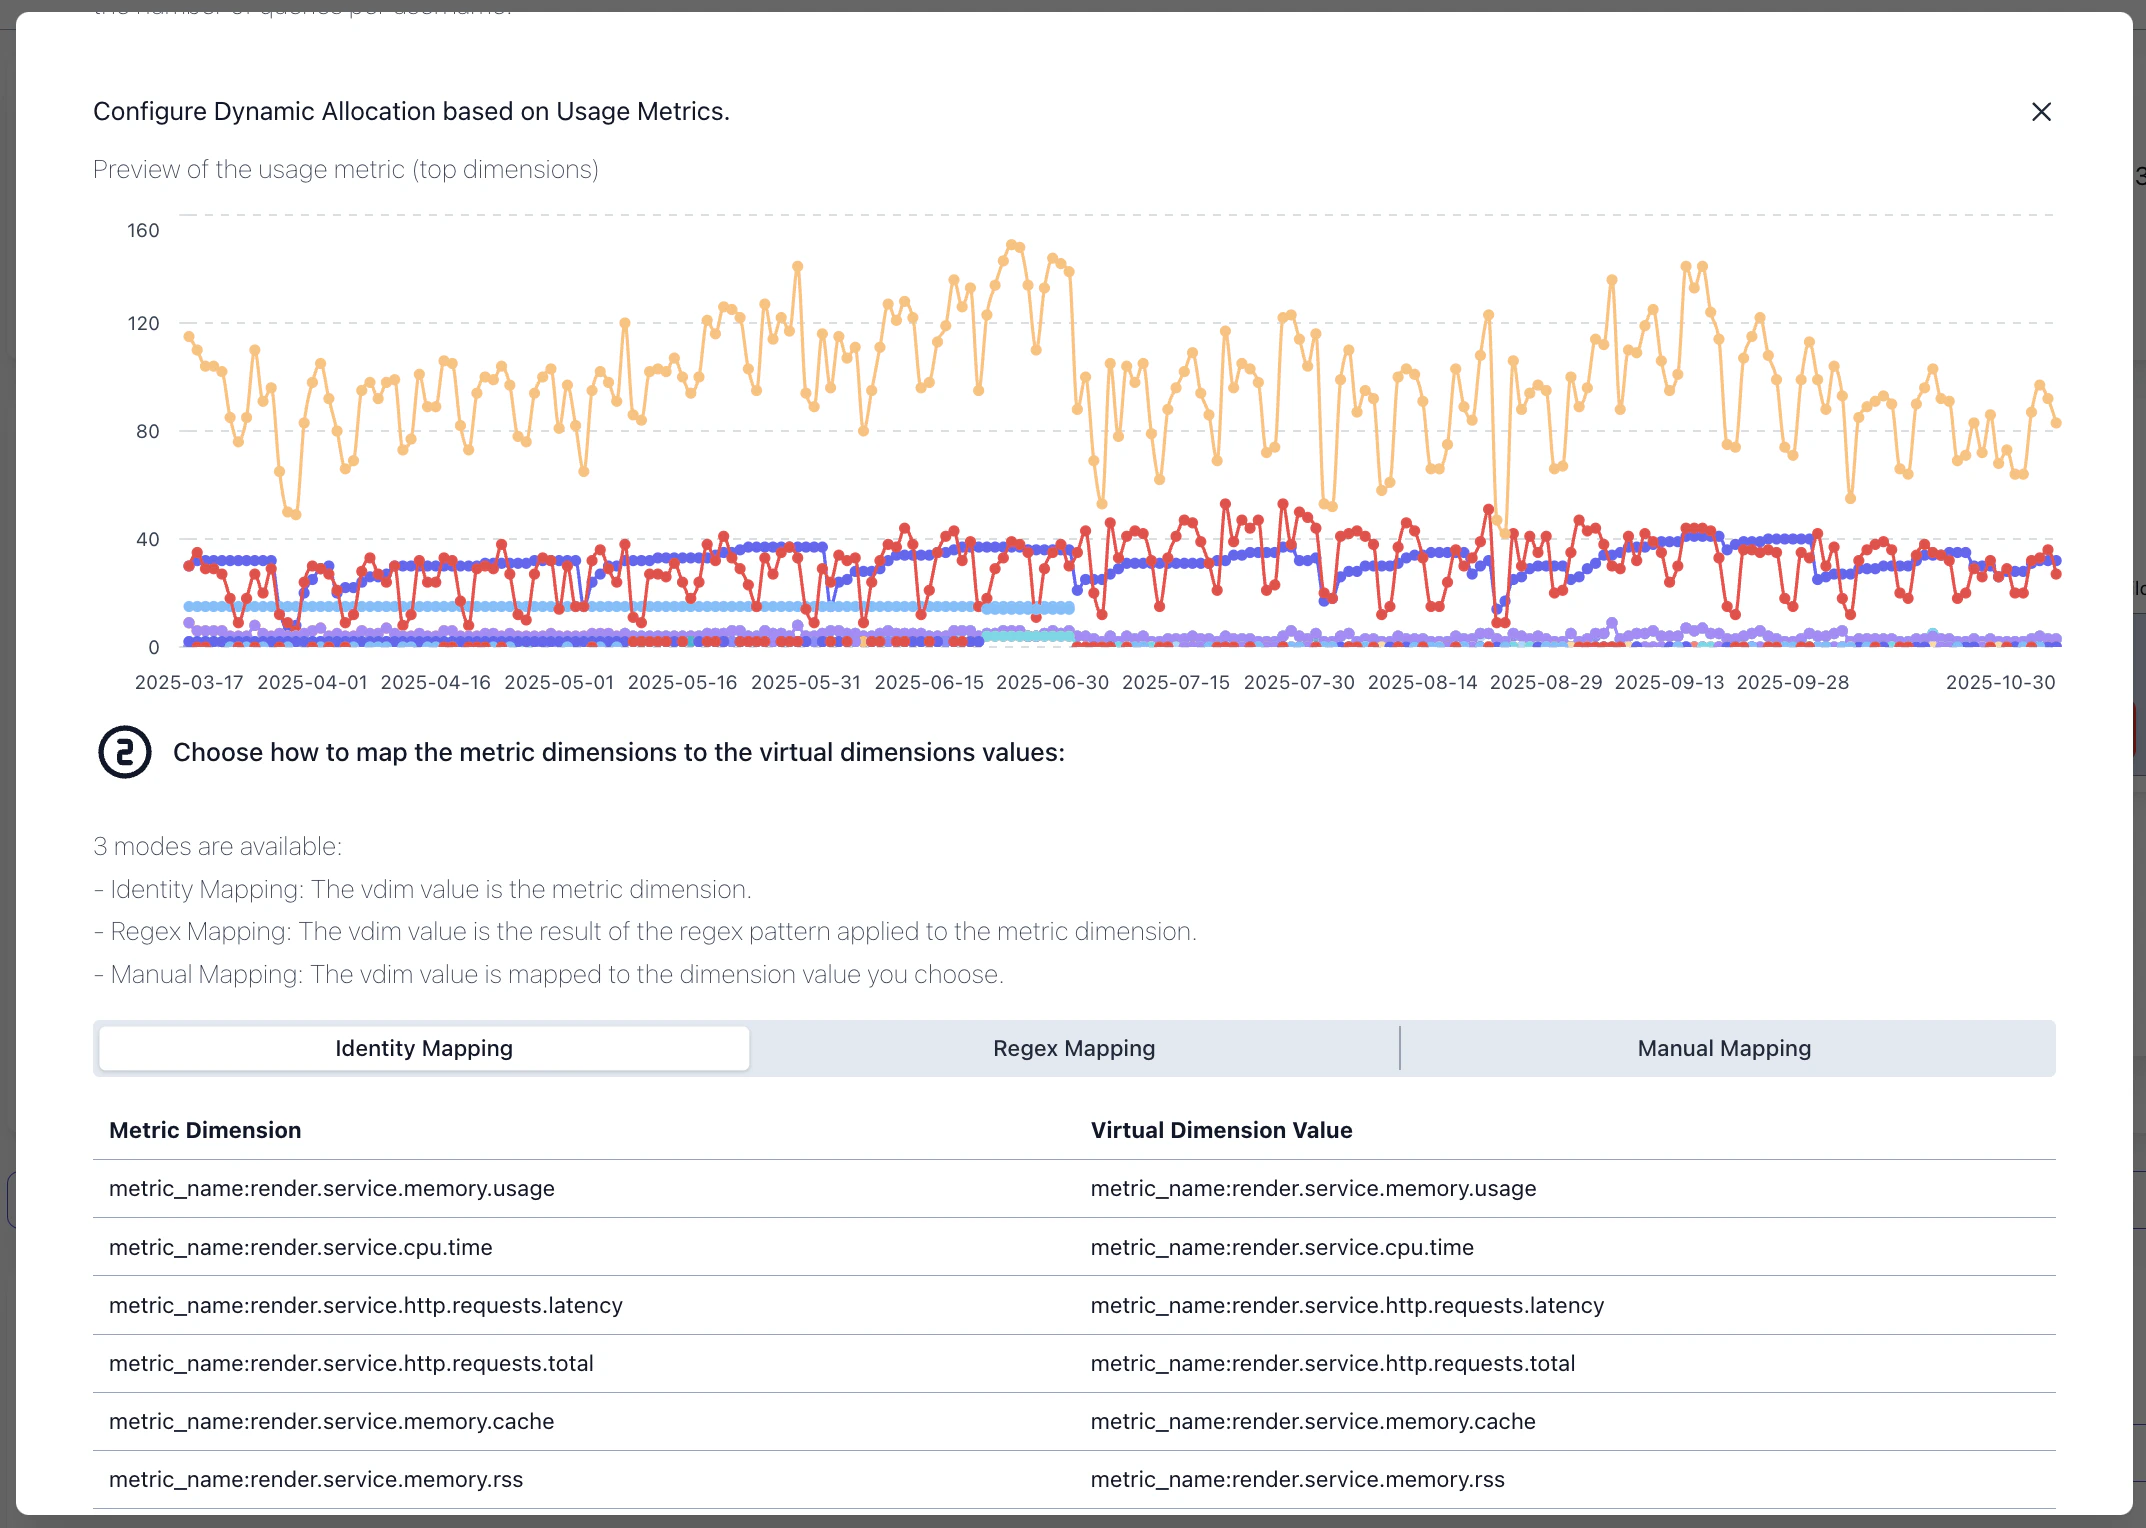
May 30 2025
Track Costs Alongside Deployments, Incidents, and Releases
Track deployments, incidents, and releases directly on your cost charts. Events appear as visual markers on timelines, letting you instantly correlate cost spikes with real-world changes. Organize events into BUSINESS, TECHNICAL, and PROVIDER categories with reusable labels across your organization.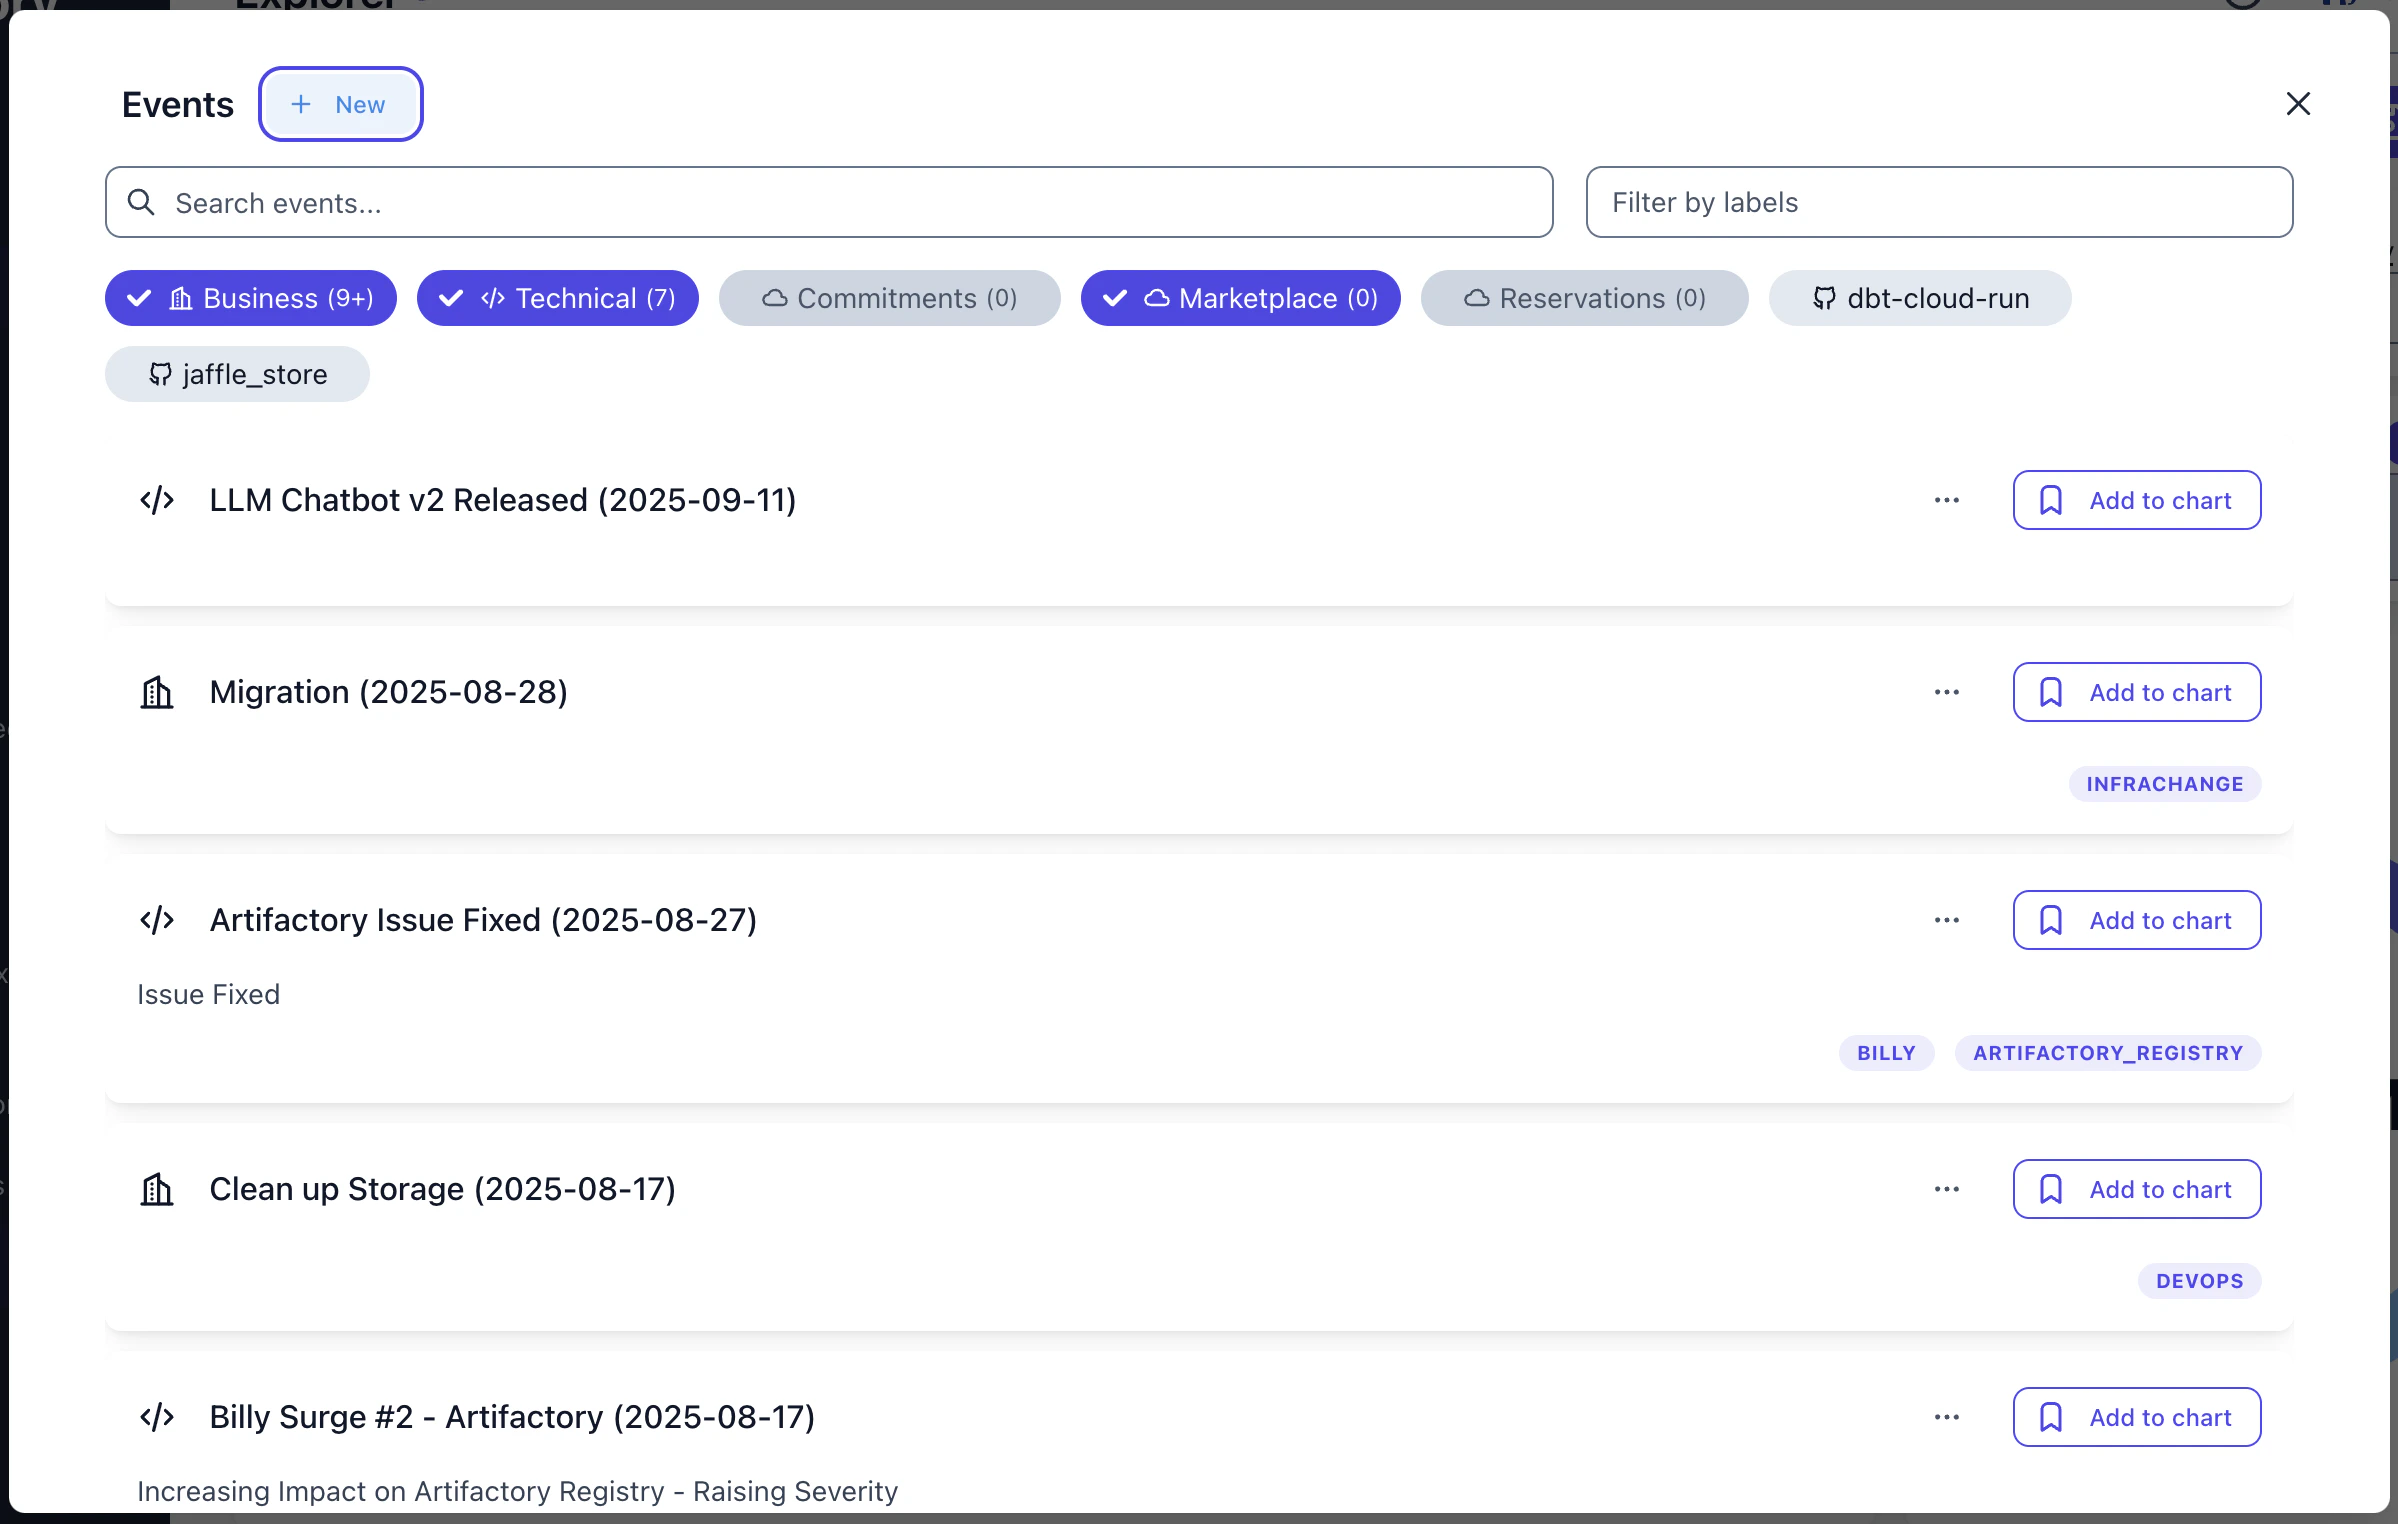
May 22 2025
Introducing the Costory Digest
Engineering teams shouldn’t have to dig through dashboards every month to figure out what changed. The Costory Digest does the work for you — it automatically analyzes your cloud costs, identifies the biggest movers, and delivers a clear summary straight to Slack on your schedule.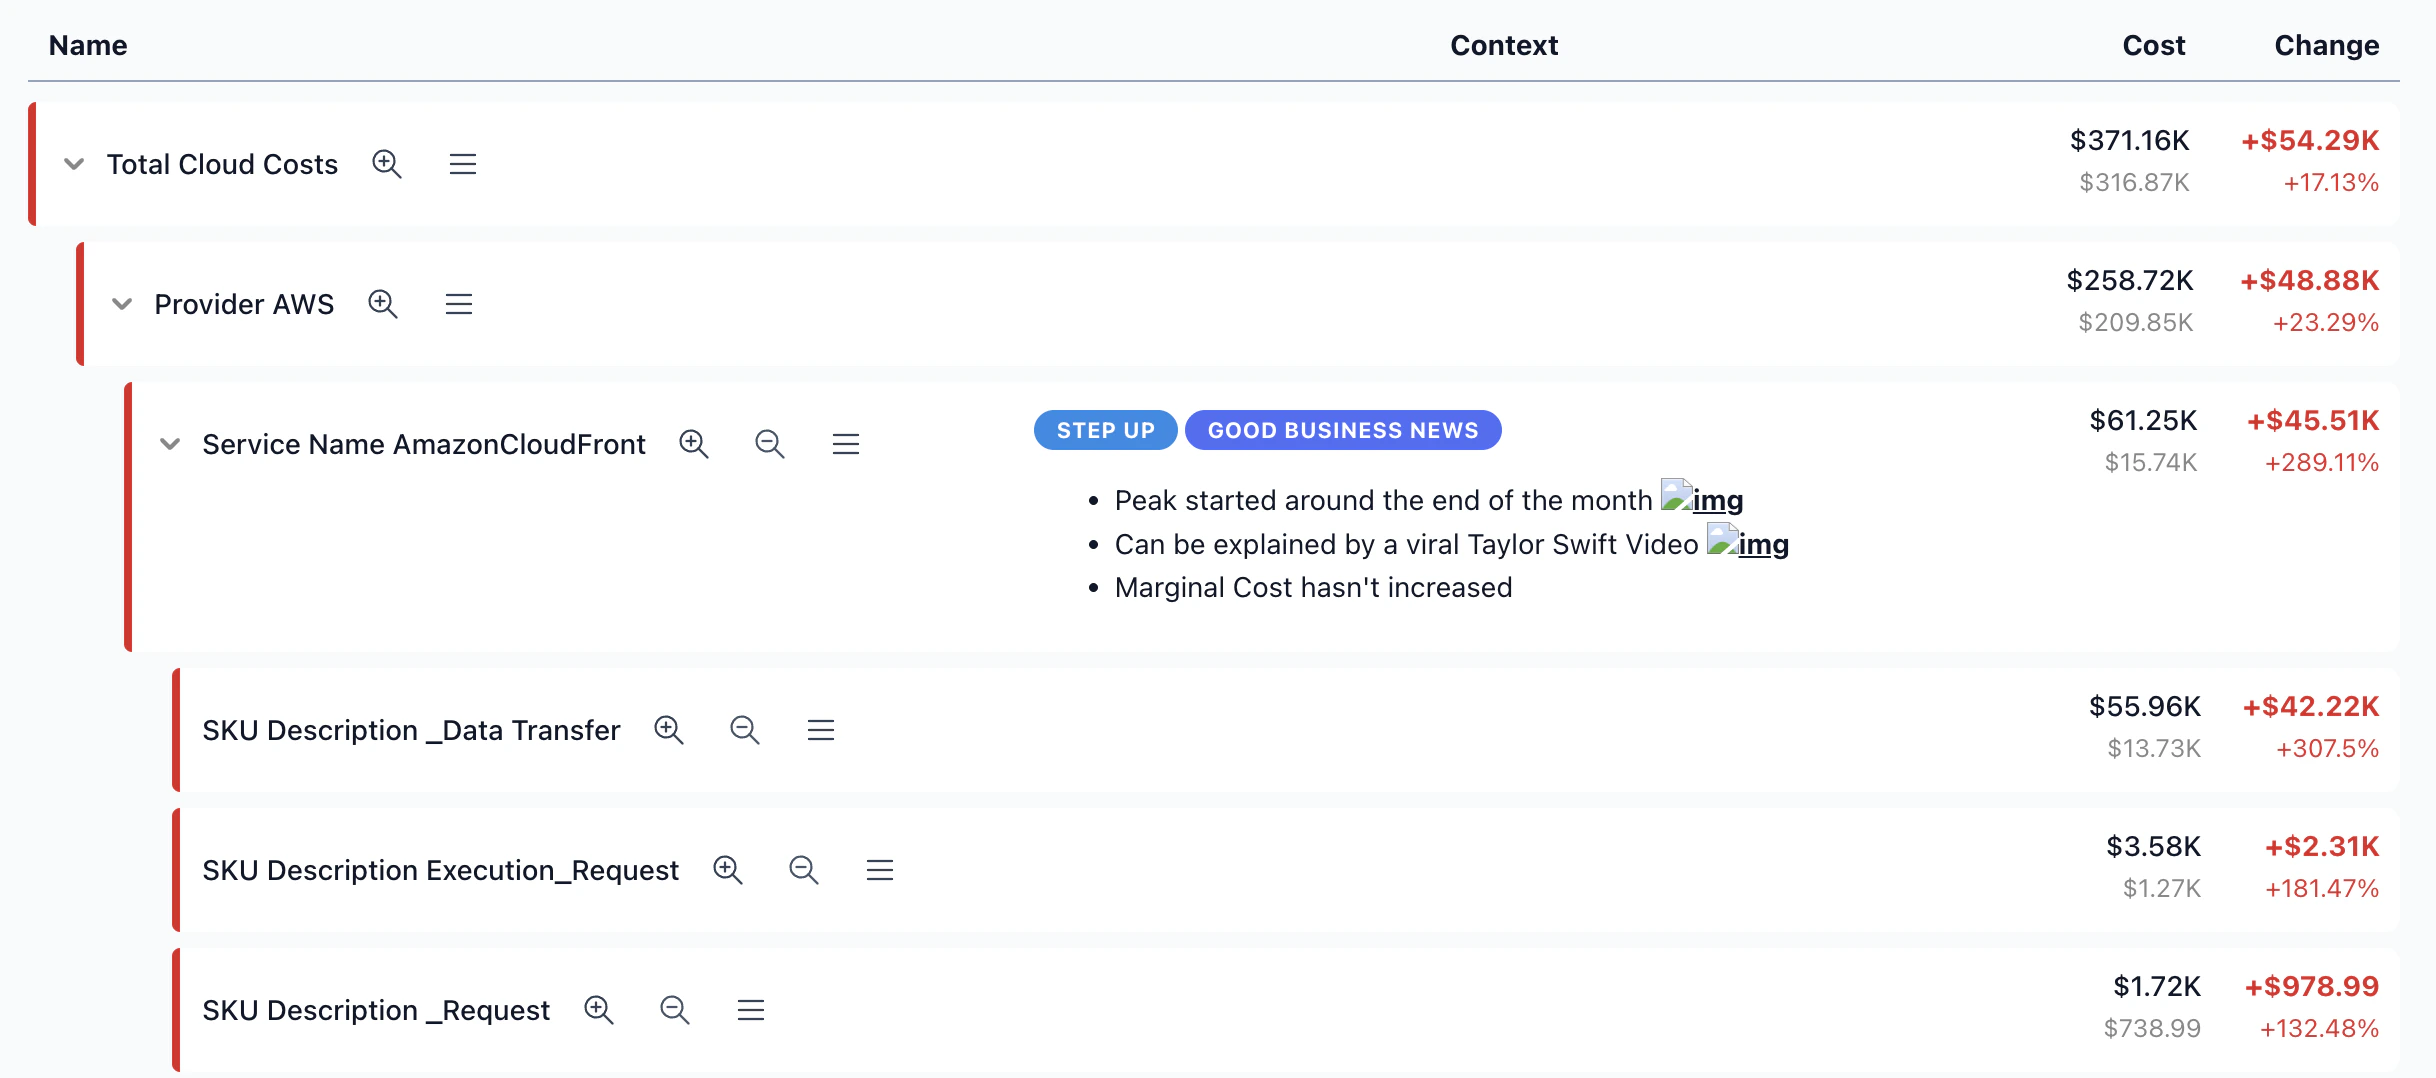
- Configurable scope — choose the time period, group-by dimensions, and filters to match what matters to your team
- Interactive charts with trend lines that highlight cost movements at a glance
- “Others” rollup so smaller line items don’t clutter the picture
- Drawer view for quick exploration without leaving your workflow
- Scheduled delivery to Slack so your Monday morning standups always start with the full picture