Prerequisites
-
Identify what drives your database cost increases:
- Storage size: choose this if the last resource increase was due to growing storage.
- Compute resources: choose this if the last resource increase was due to CPU or memory pressure.
- Know where the usage metric is available (e.g., Datadog, Google Cloud Monitoring).
Output
- Gain visibility into each team’s cost contribution.
- Schedule recurring reports to share cost allocation with stakeholders.
- Set alerts if a team’s share grows unexpectedly.
Steps
Choose the correct metric
Select the metric that matches your cost driver. Below are example queries for Datadog and Google Cloud SQL.Storage sizeCompute resources
- Datadog
- Google Cloud SQL
- Datadog
- Google Cloud SQL
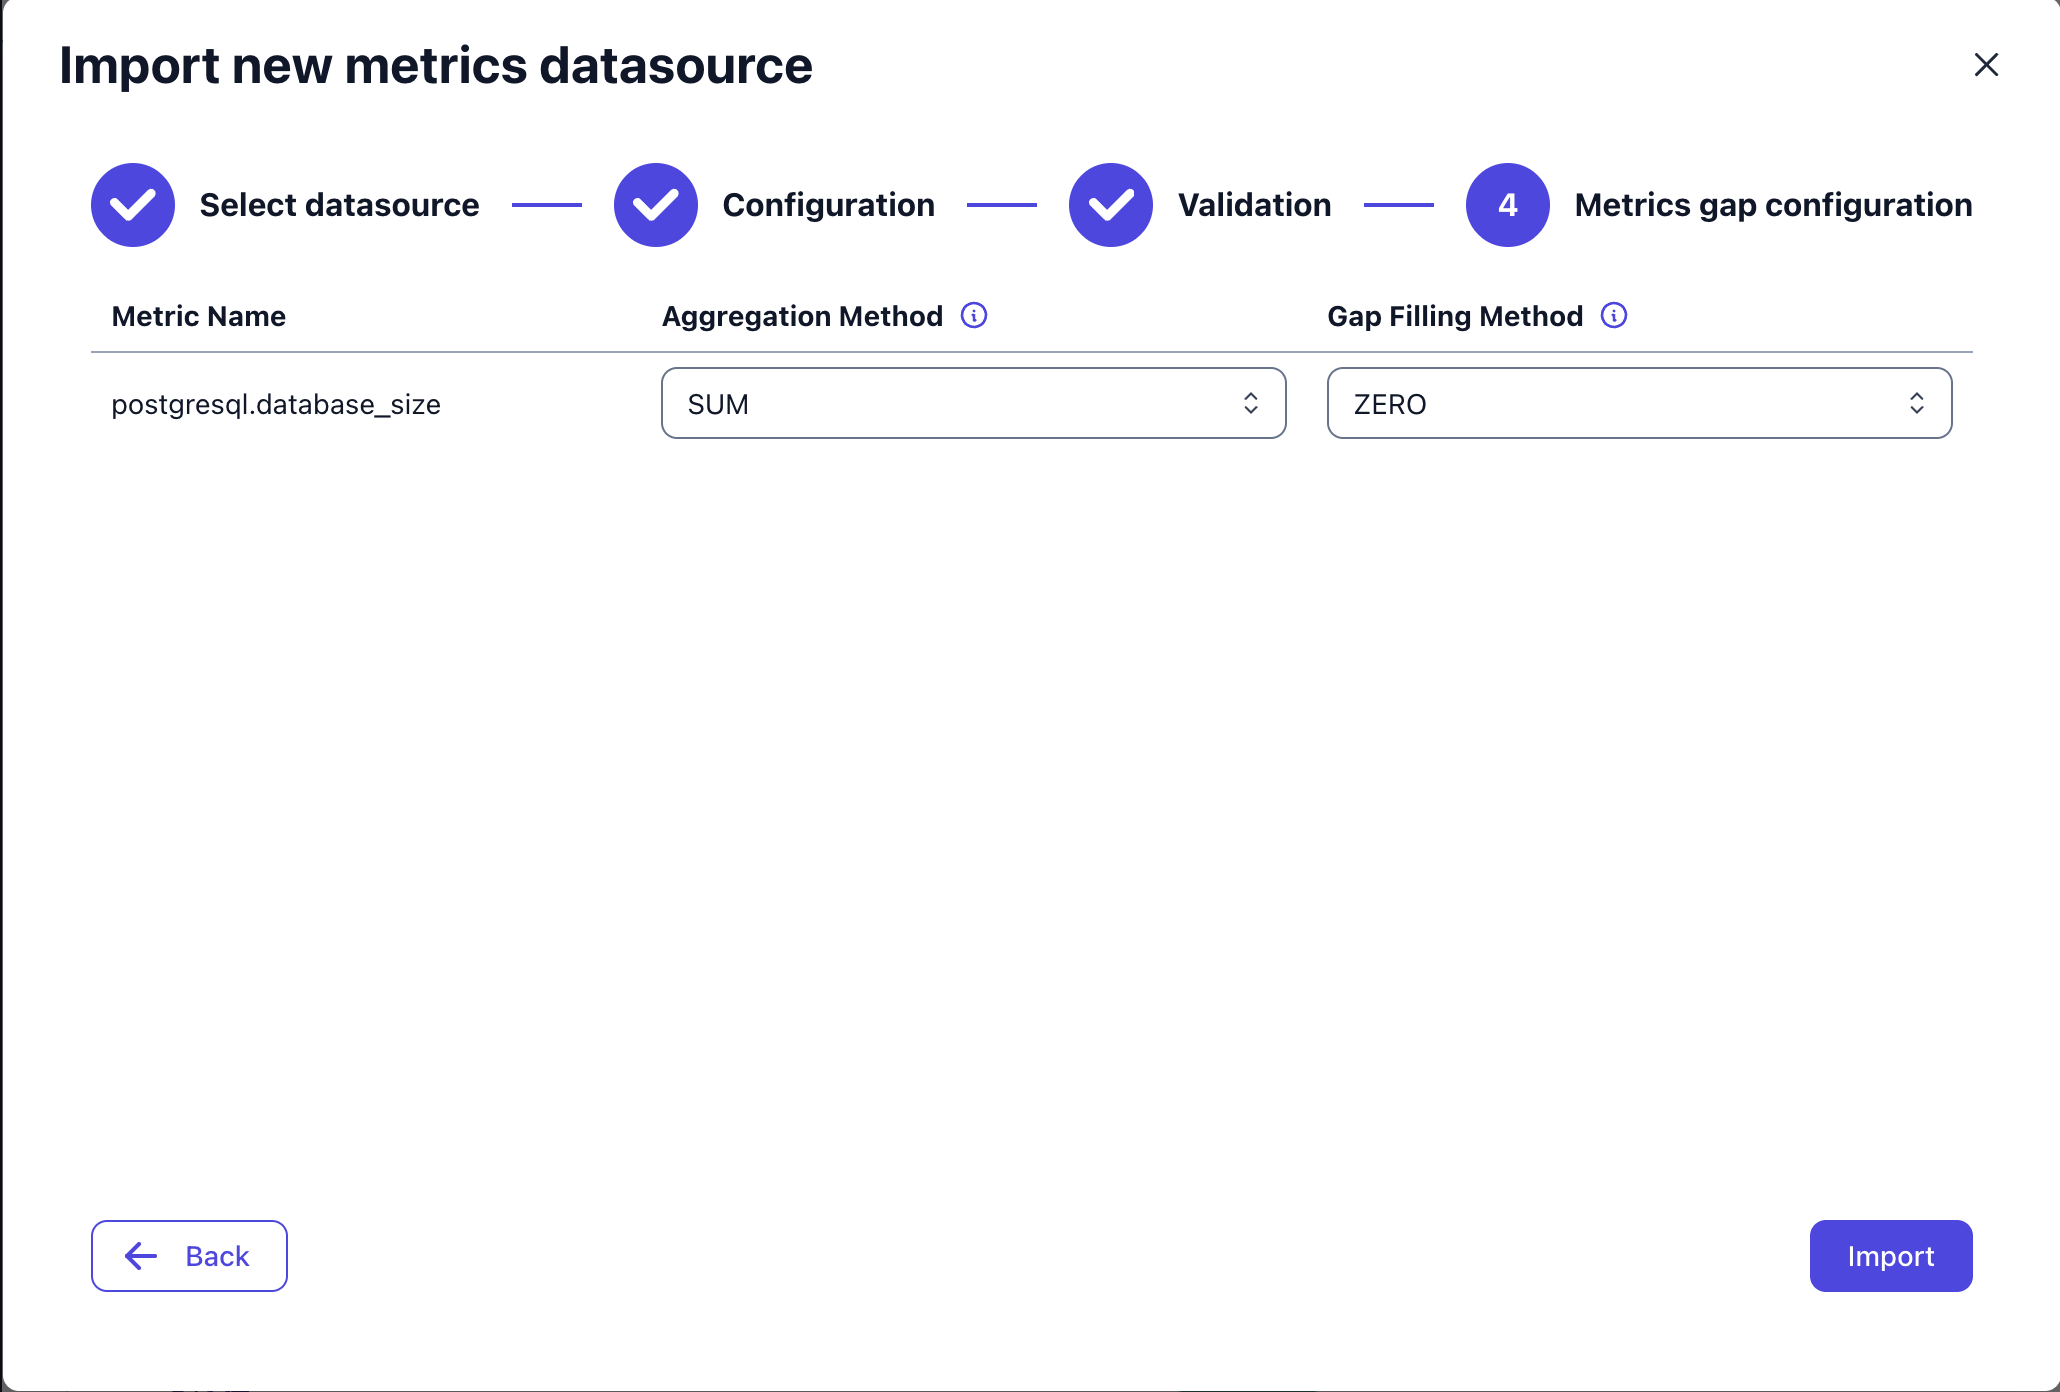
Import the metric in Costory
Go to Costory Metrics and import the metric.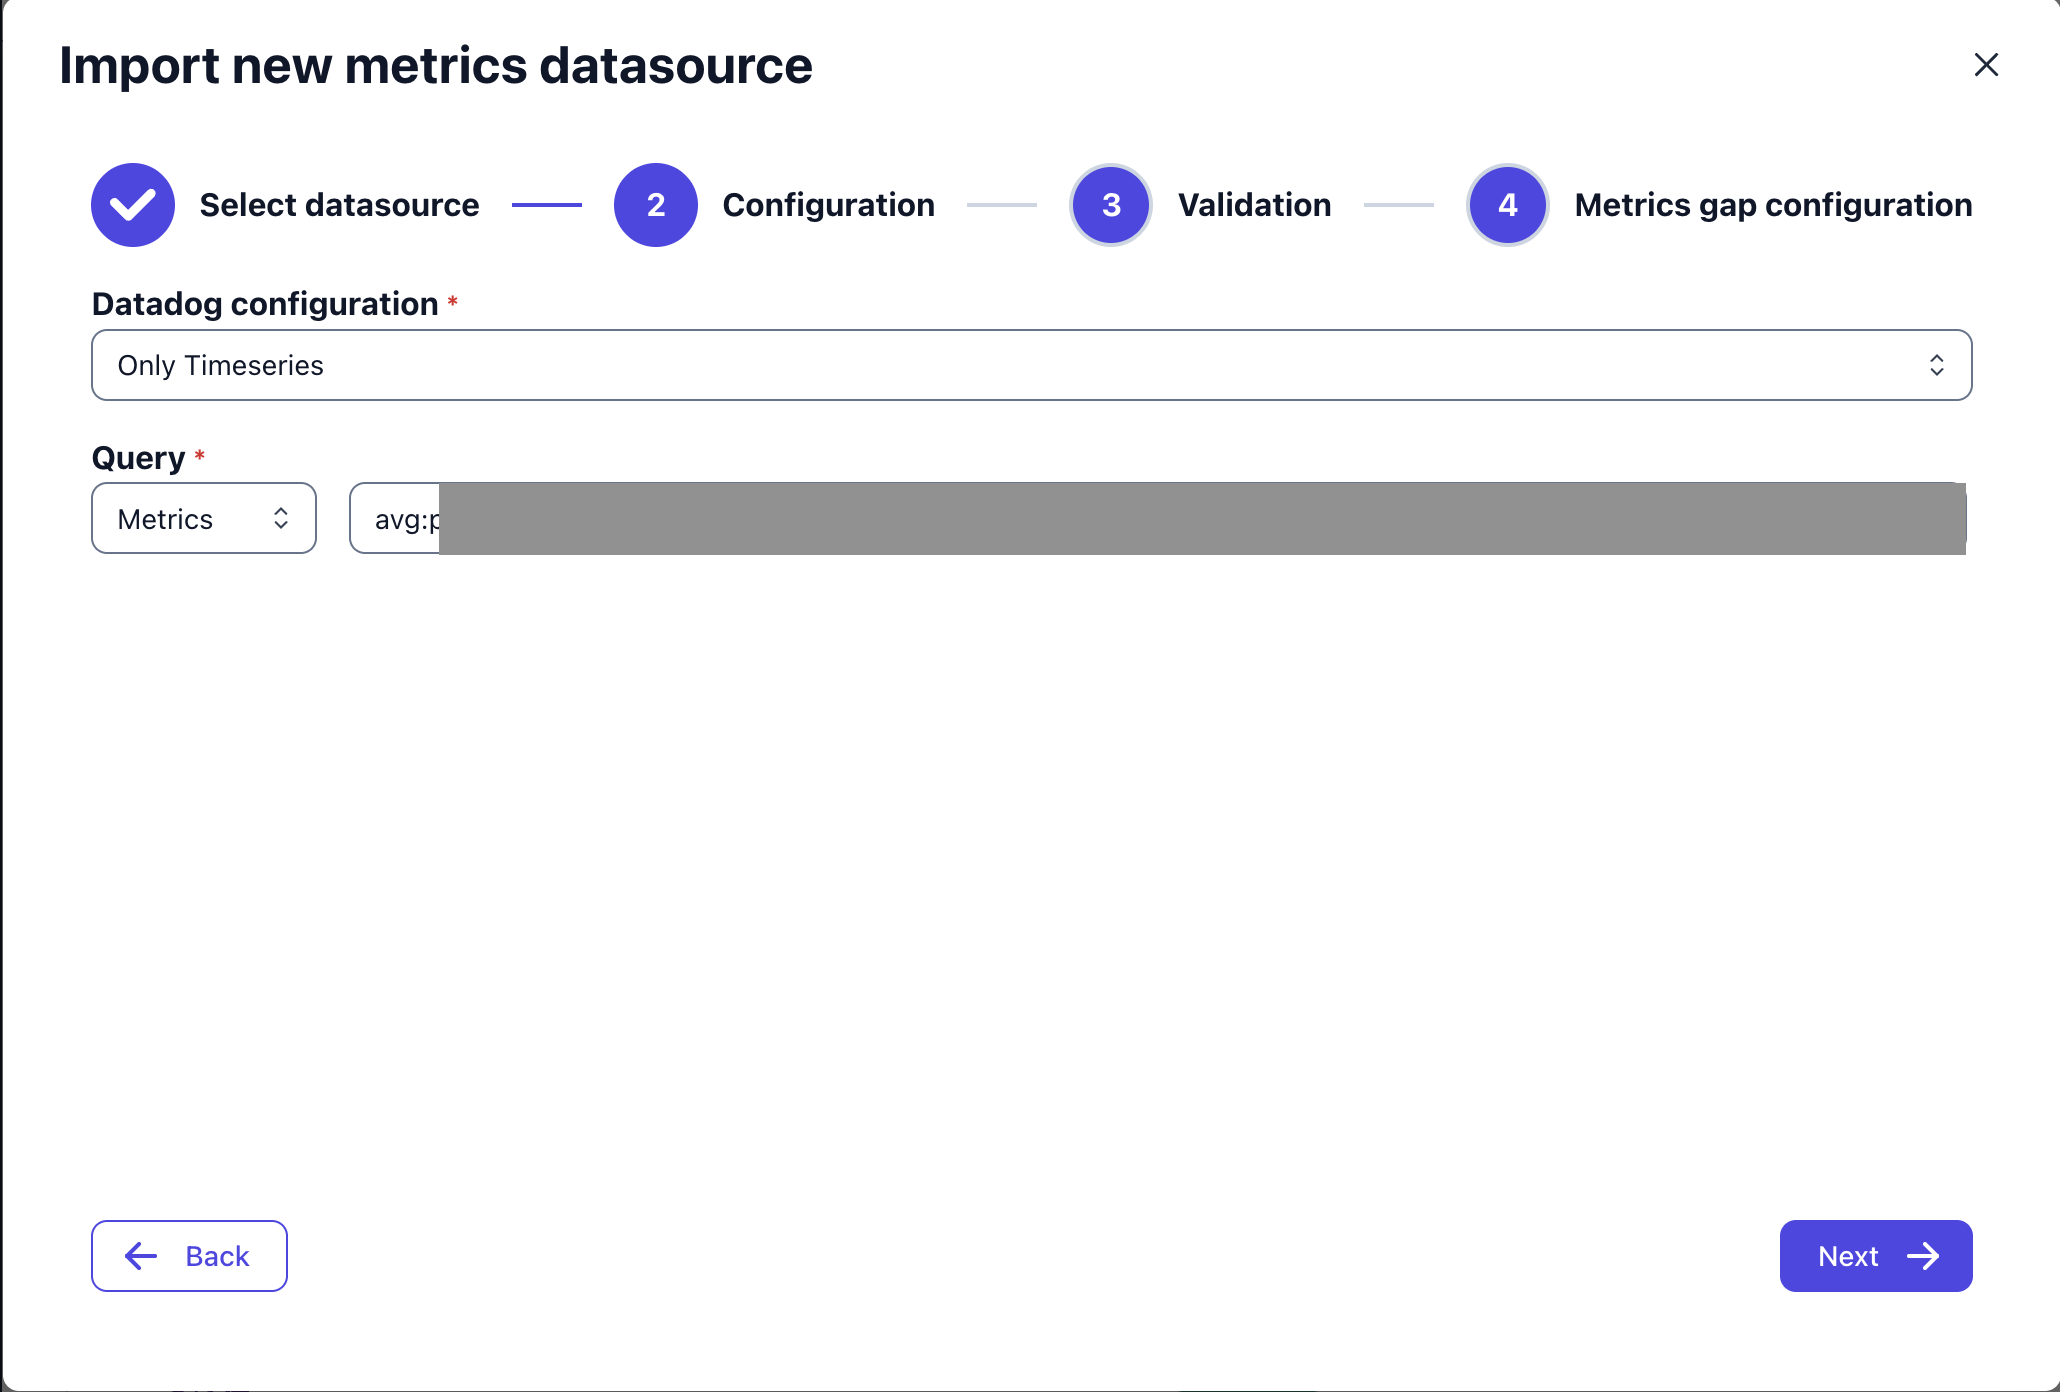
Preview the result using Explorer
Go to Explorer and query the metric you just imported. Verify that the per-team breakdown looks reasonable before creating a virtual dimension.
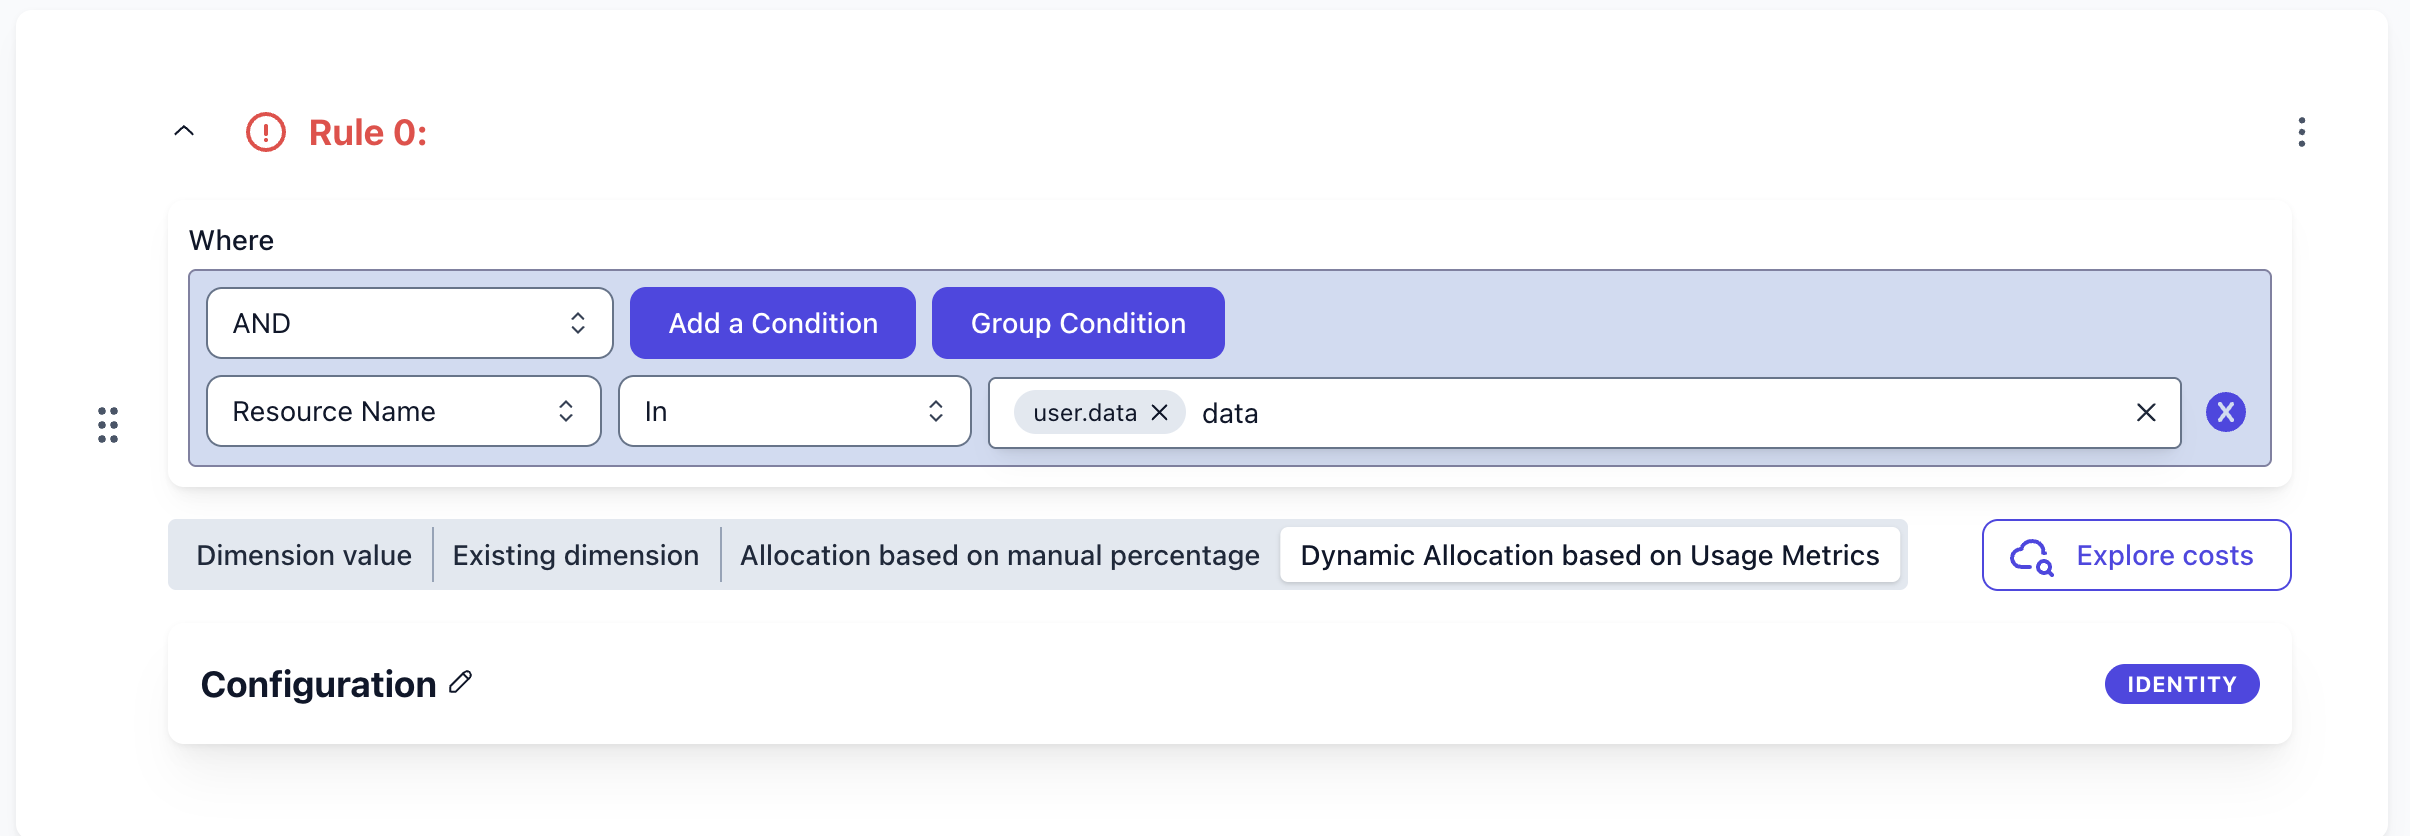
Create a virtual dimension to allocate the cost
- Go to Dimensions and create a new virtual dimension.
-
Rely on a filter on
resource_idor resource name to scope the database cost correctly. -
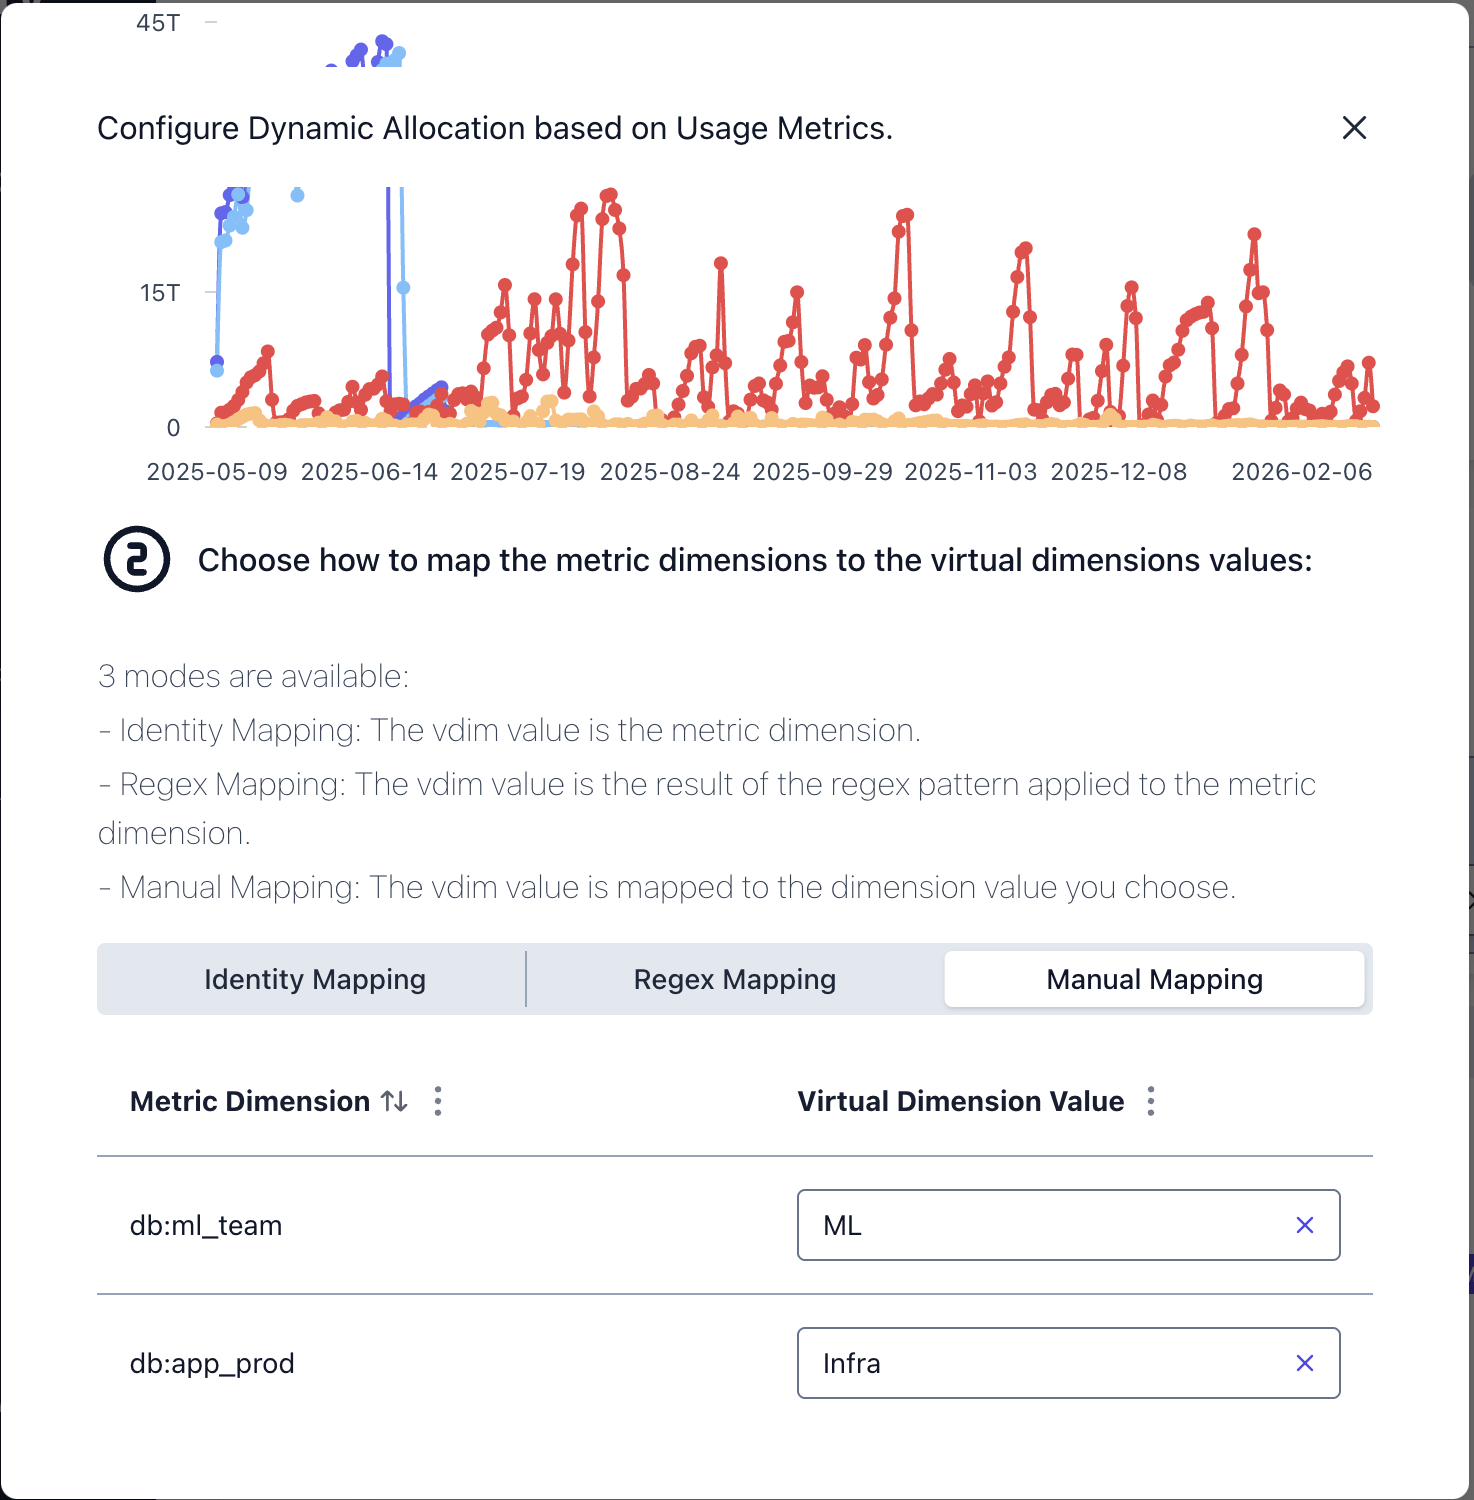
Instead of relying on dimension value mapping, use the Dynamic allocation based on usage metrics option:
-
Map the group-by dimensions to the correct team or owner. You have three options:
- Identity mapping: your database name equals your team name.
- Regex mapping: your database name contains your team name (extract it with a regex).
- Manual mapping: your database name has no relation to the team name; map each name manually.
- Save the virtual dimension.
Create a report to visualize the cost allocation
Go to Explorer and create a new report using your virtual dimension as a group-by. You can also schedule the report to be sent to Slack on a weekly or monthly basis.
Related
- Need to allocate a shared API instead of a database? See Split Shared API Costs Across Teams for a step-by-step guide using an external usage metric like API call counts.