Support Matrix
Click a datasource to jump to the right setup steps.CSV
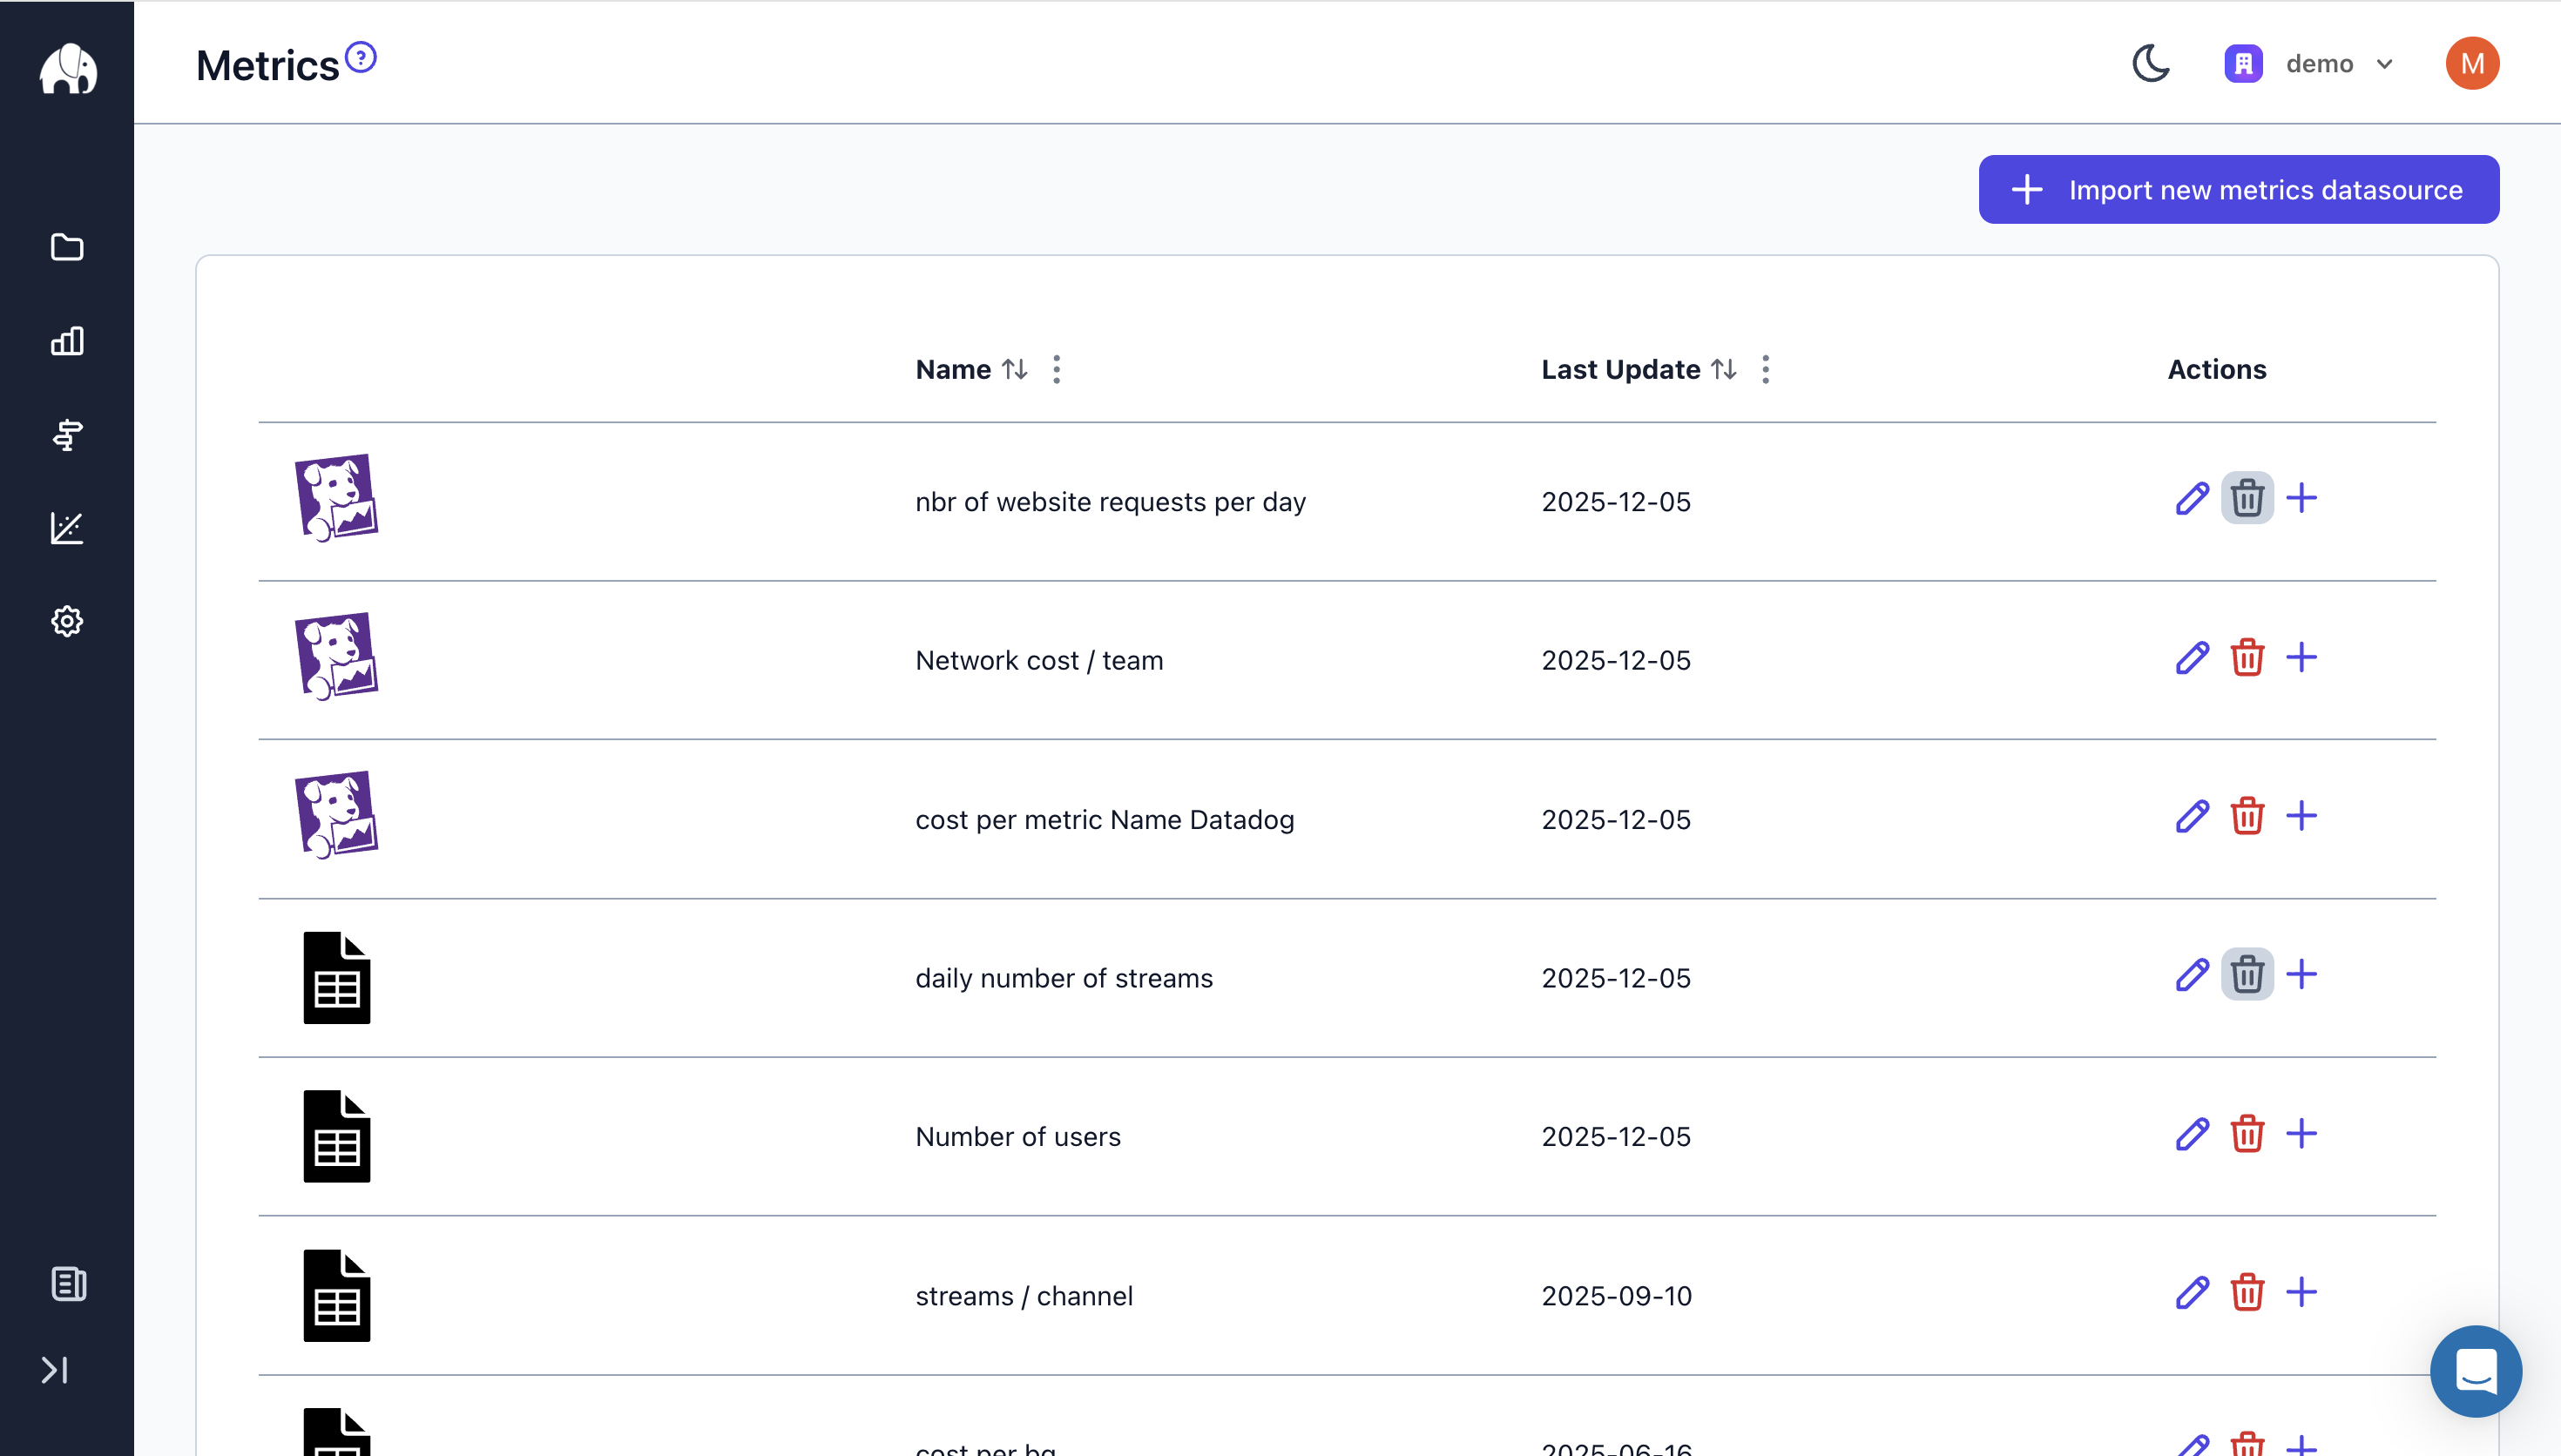
Upload usage metrics as a flat or columnar CSV.
Google Sheet
Sync metrics directly from a Google Sheet.
Datadog
Query Datadog metrics with rollups.
Datadog CI
Pull CI visibility metrics from Datadog.
BigQuery
Import metrics stored in BigQuery tables.
GCS Inventory
Use GCS inventory Parquet exports.
Amplitude
Bring product analytics metrics into Costory.
S3 Parquet
Import Parquet metrics files from S3.
Tsuga
Import metrics, logs, and traces from Tsuga.
Next Steps
Connect Events
Add deploys and incidents for full context.
Build Reports
Create automated reports with your metrics.