Create monthly cloud cost budgets by team, track versions, and trigger Slack or email budget alerts before overruns.
in Costory give engineering teams monthly cloud cost budgets with built-in budget alerts. Instead of maintaining spreadsheets, you define budget lines by , assign owners, and monitor Budget, Actual, Forecast, and Delta in one place.
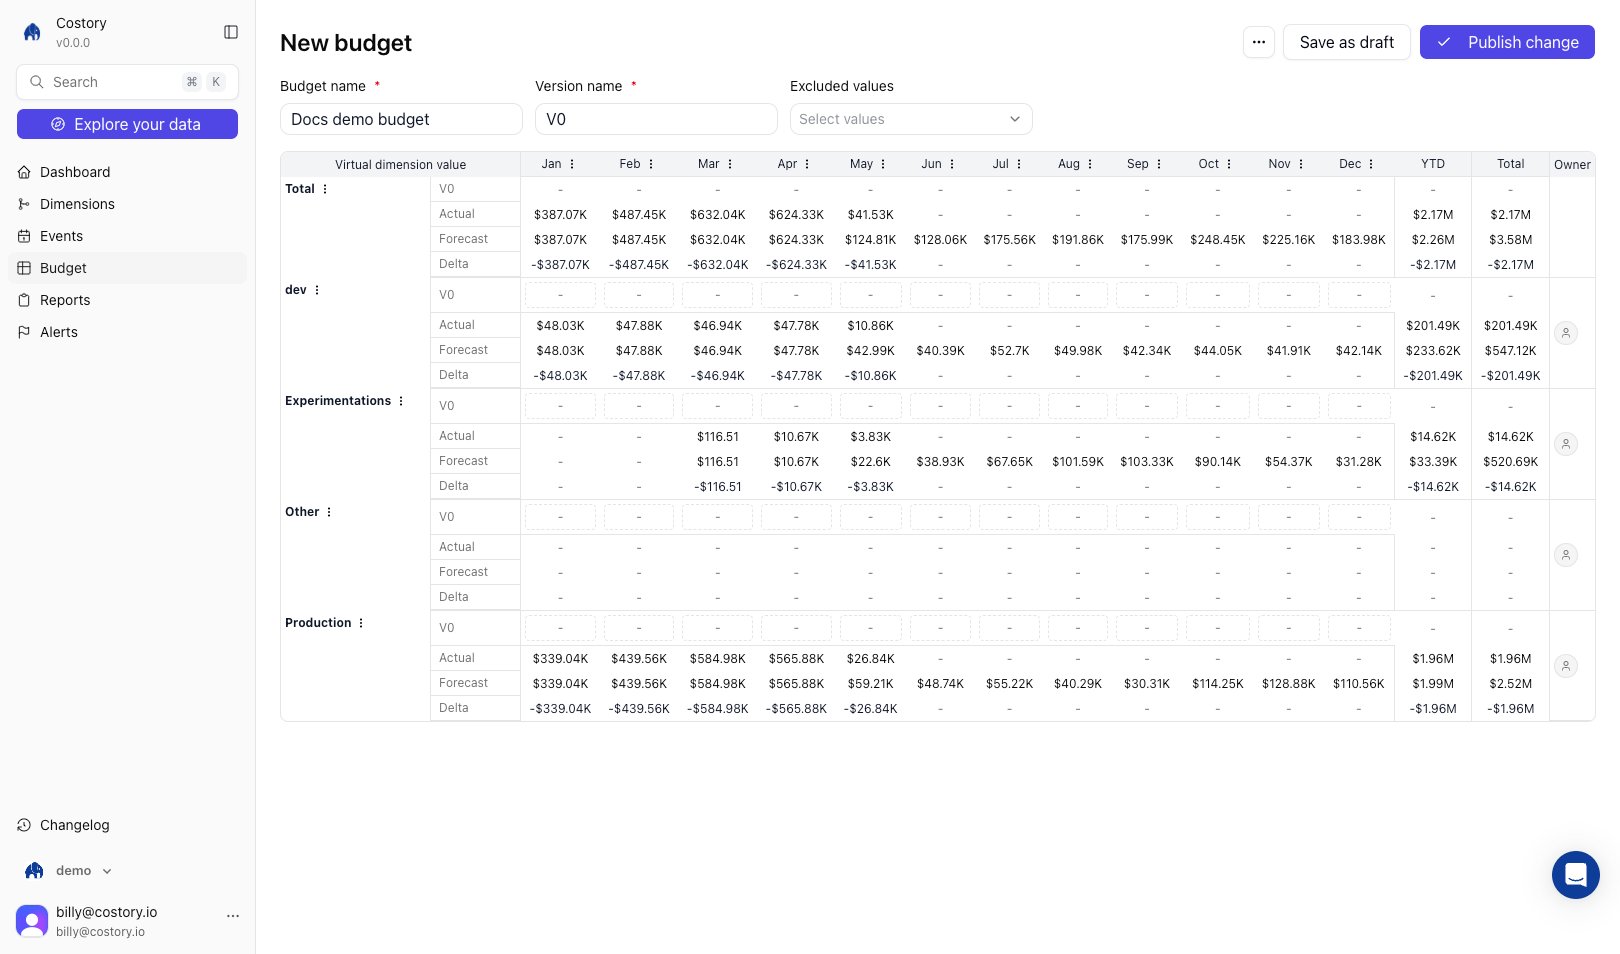
Budget table with version, actual, forecast, and delta per budget line
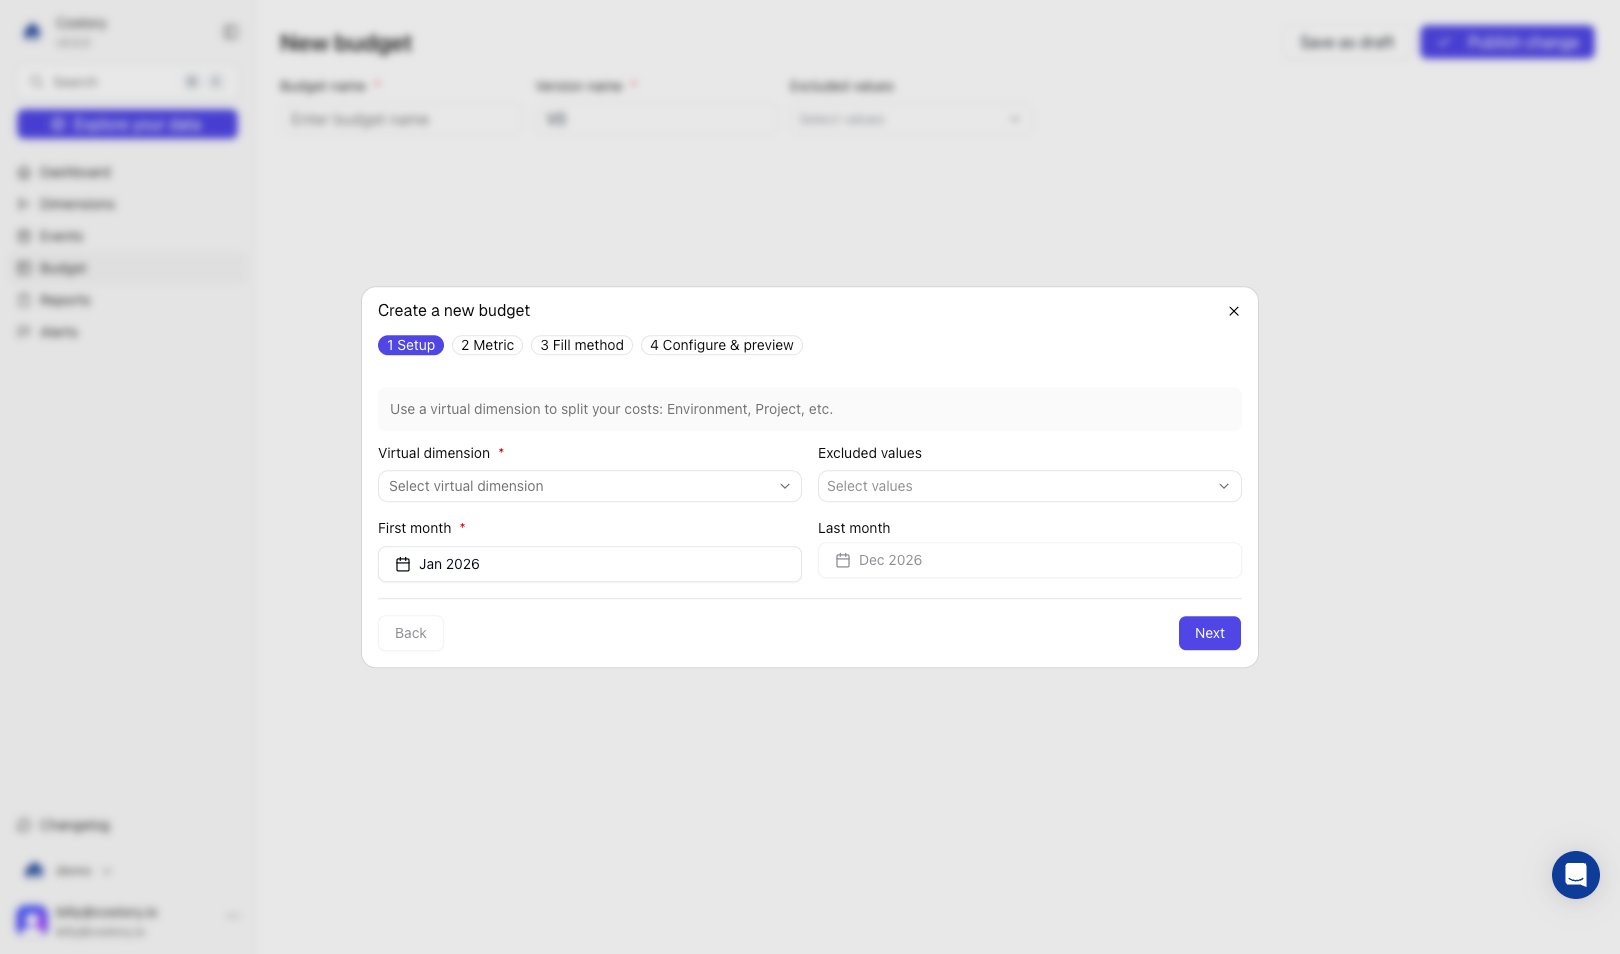
Open Budgets and click Create a new budget. In Setup, choose the dimension that splits costs into budget lines, for example team, business_unit, or environment, set First month and Last month, and optionally exclude dimension values you do not want in the budget.
Setup step: virtual dimension, date range, and excluded values
2
Choose your budget metric
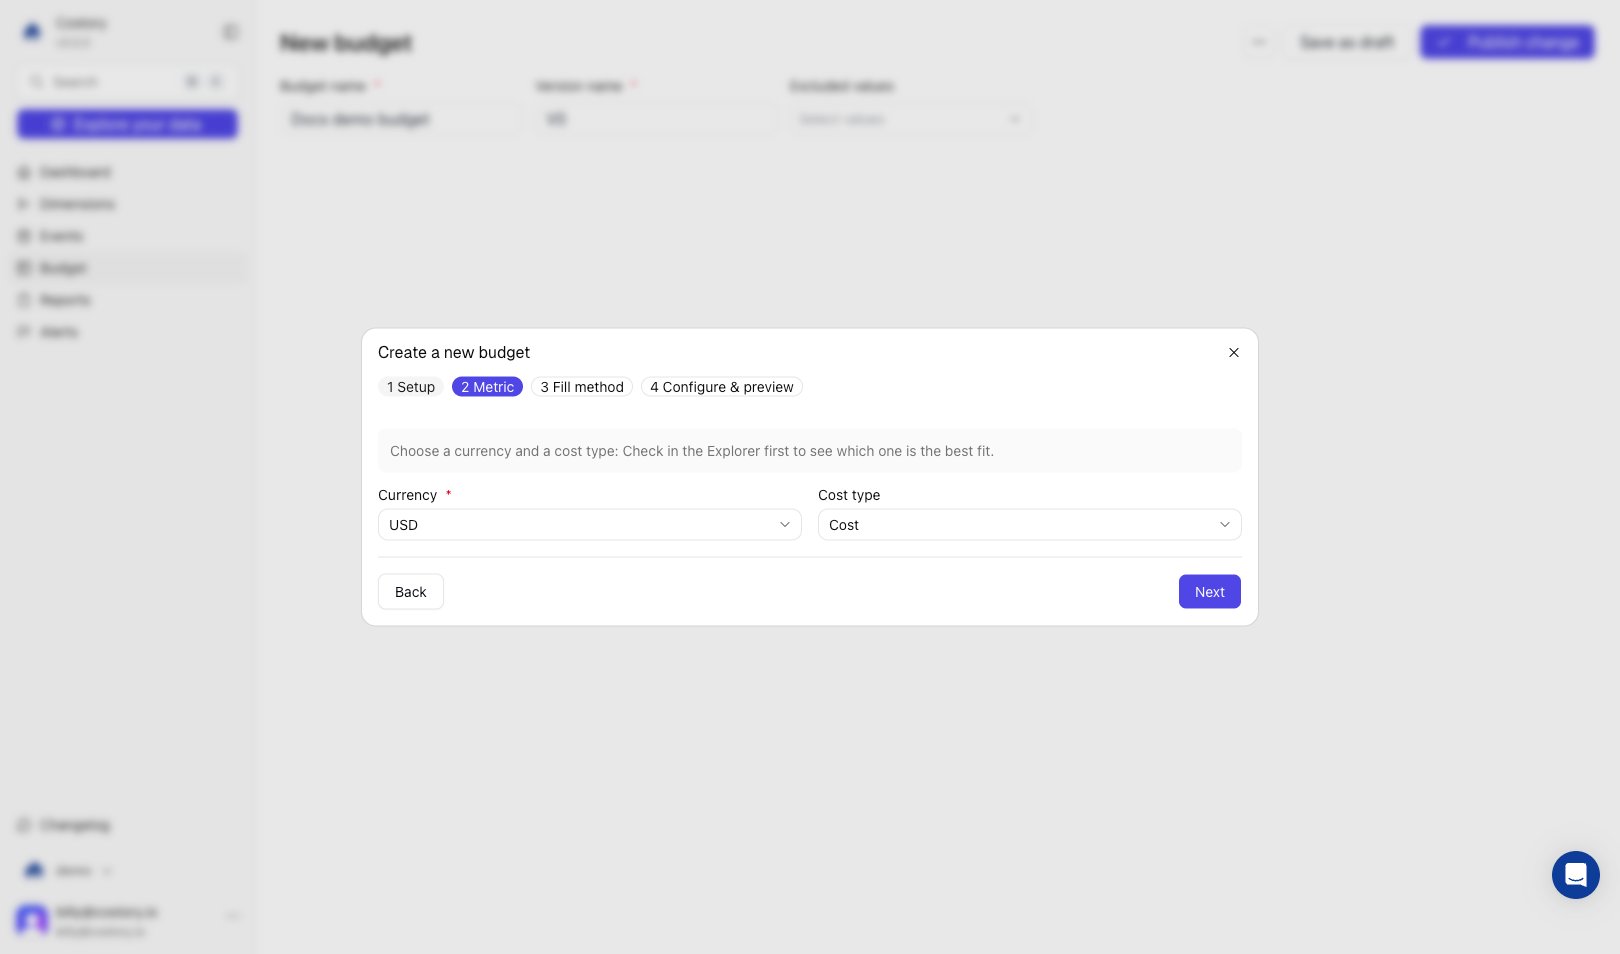
In Metric, select the Currency and Cost type used to evaluate budget performance. Pick the metric your stakeholders already use for monthly reviews.
Metric step: currency and cost type
3
Choose a fill method
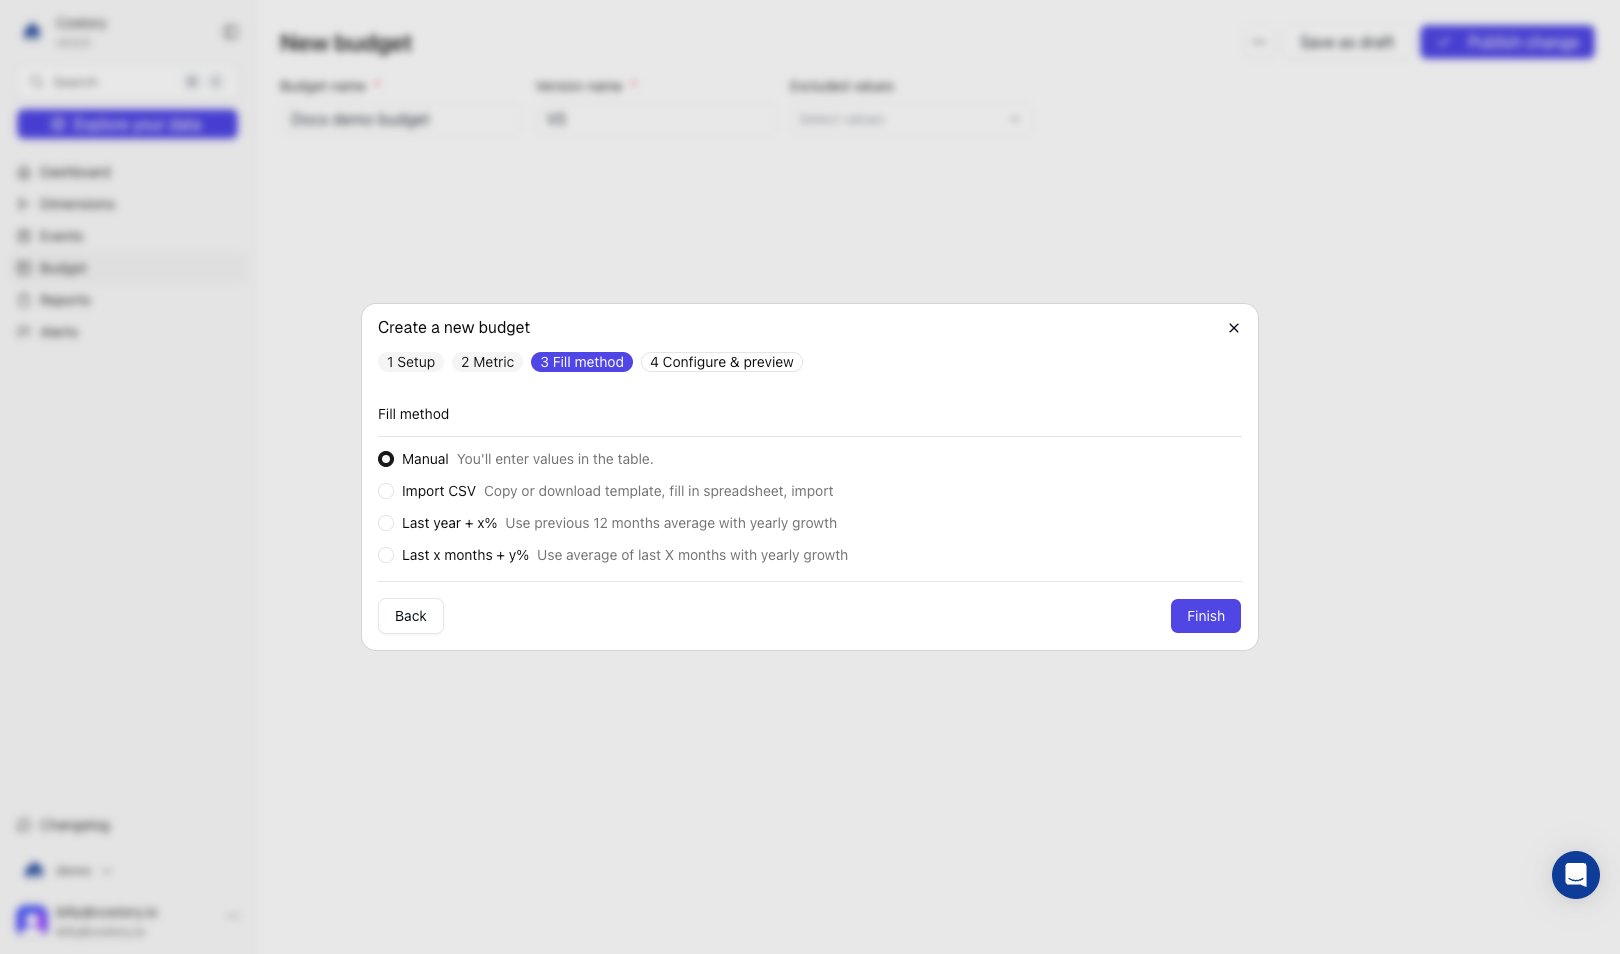
In Fill method, initialize monthly budget values with one of the available strategies.
Fill method
When to use
Manual
You already have approved values and want direct control
Import CSV
Finance prepared values in a spreadsheet
Last year + x%
You want a simple growth model on last year’s baseline
Last x months + y%
You want a moving baseline with growth applied
Fill method step: manual, CSV import, or growth-based baselines
4
Configure, preview, and assign owners
After you finish the wizard, review the Configure & preview grid. Enter or adjust monthly budget values, then assign an Owner per line so alerts and reviews go to the right person.
5
Configure budget alerts
Monitor specific budget lines and add threshold rules. You can alert on:
Actual spend exceeds threshold
Forecasted end-of-month spend exceeds threshold
Send alerts by Email or Slack, and include line owners in notifications for faster escalation.
6
Save and manage versions
Save the configuration as a budget version. When assumptions change, create a new version and keep past versions for historical tracking and auditability.
Use dimensions to structure budgets around how your organization operates. You can budget per team, product, environment, or any business mapping already used in Costory.
Costory uses TimesFM by Google to forecast end-of-month values for each budget line. This helps you escalate risk before an overrun appears in invoiced costs.
Each budget line can be assigned to a specific owner. This enables practical showback, because teams can see their own target, actual spend, forecast, and delta in one place.
Alert rules reduce manual monitoring overhead. Teams get notified when spend risk appears, then can jump to Explorer to find the root cause and take action.
Plot budgets alongside actual cost in Explorer and dashboards
You can plot any budget as an area chart directly in Explorer. Open the metric selector, switch to the budget tab, and pick the budget you want to visualize. Costory renders the budget values per month as a shaded area, so you can see at a glance whether actual spend is tracking above or below target.
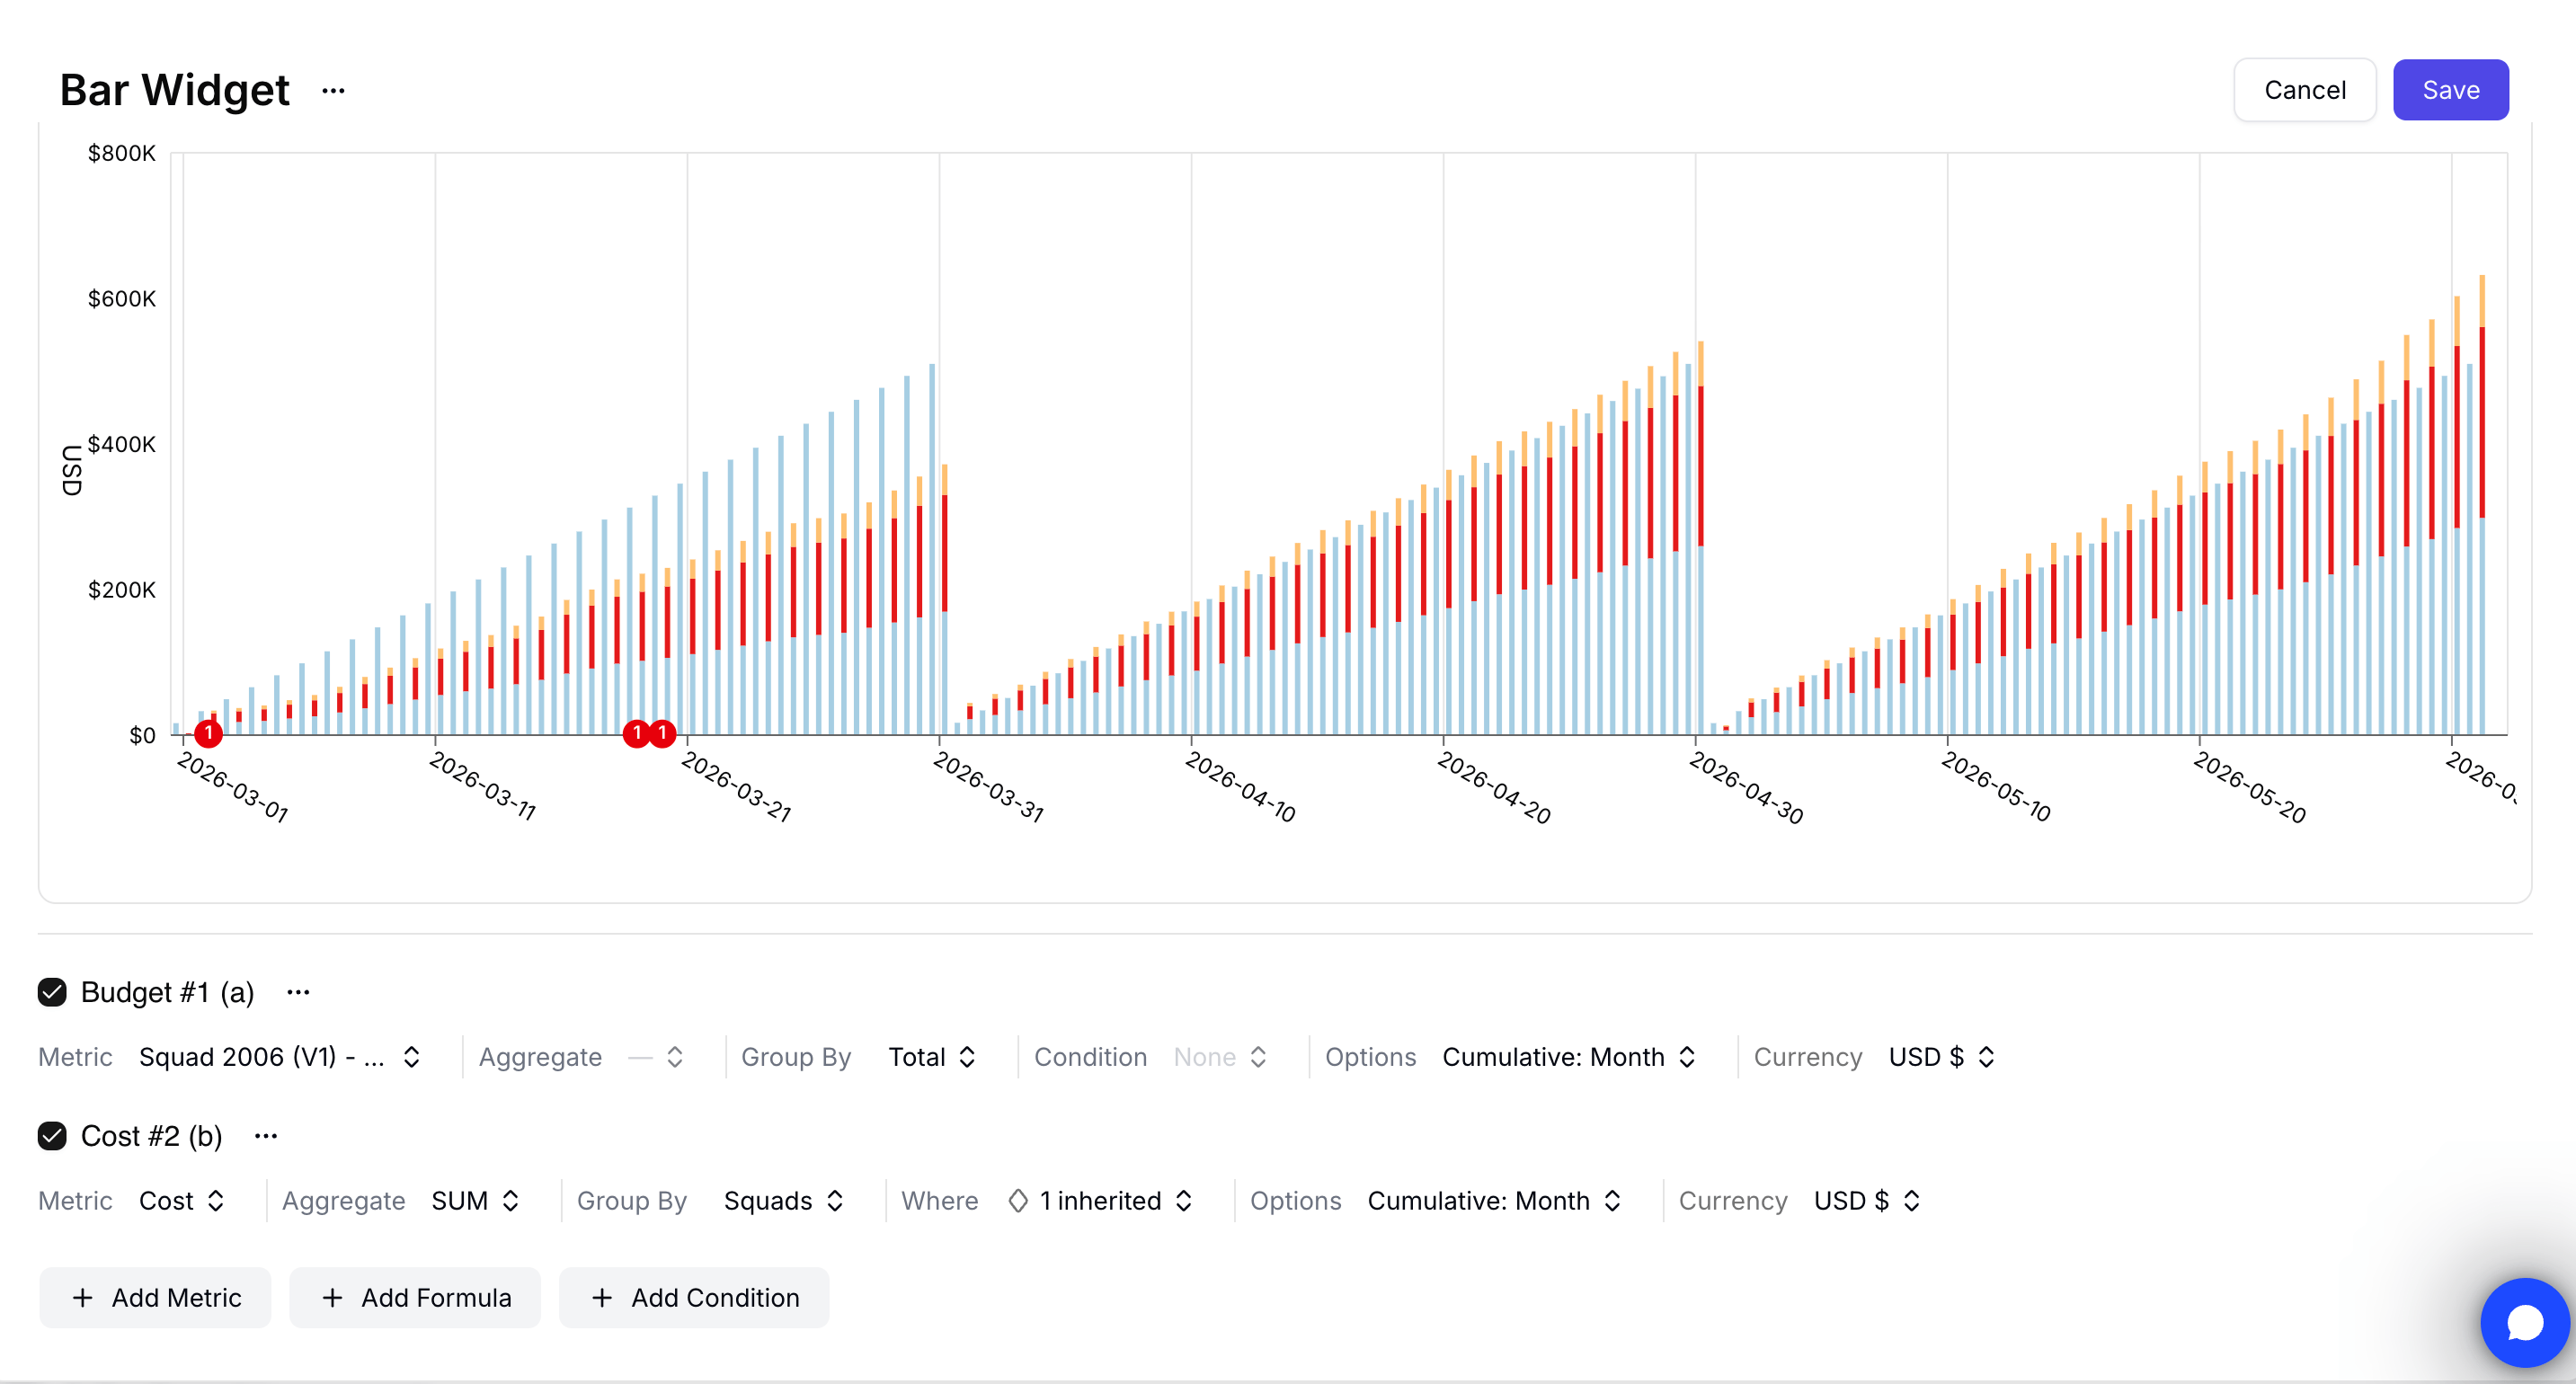
A dashboard widget comparing a budget target with related actual spend grouped by squad
Click Add related cost in the query bar to automatically add a cost series scoped to the budget’s definition. Costory pre-fills the filters and group-by so plotted cost aligns with the budget lines, no manual configuration needed.You can use the same metric setup inside a dashboard widget. Edit the widget, add the budget as a metric, click Add related cost, and group the related cost by team or squad to analyze actual spend against the overall budget.