Overview
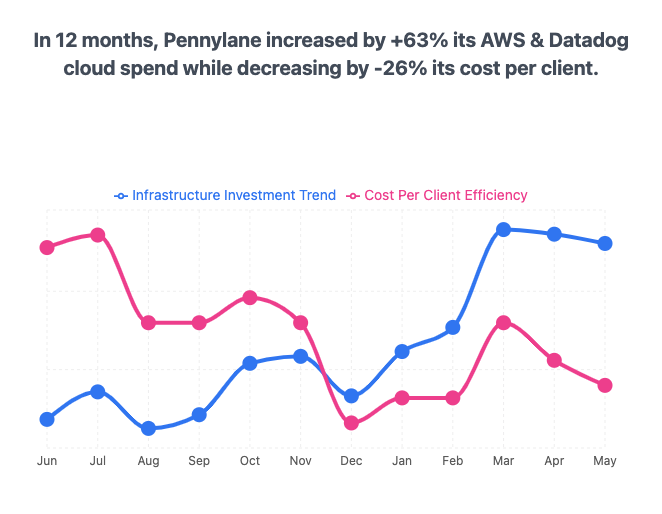
Costory Explorer lets you combine cost metrics, usage metrics, and formulas in the same chart. Instead of stopping at “compute spend increased”, you can track “cost per active user decreased” or “cost per transaction crossed our target”. Use unit economics when you need to:- Explain cloud cost increases in the context of business growth
- Track cost per customer, API call, transaction, build minute, or container-hour
- Compare efficiency by team, service, region, or product
- Report engineering improvements in the same terms finance and leadership use
What you can build
- Track infrastructure ratios such as cost per GB transferred, build minute, or container-hour by dividing cloud spend by usage metrics from your billing data or Datadog.
- Track application ratios such as cost per API call, daily active user, or transaction by connecting external metrics from Amplitude, BigQuery, CSV, or Google Sheets.
- Compare the cost of a new service against the service it replaced by grouping formulas by service tag.
- Track realized savings from or CUDs by computing
list_cost - total_cost. - Build custom KPIs for commitment utilization, coverage, and ROI.
Metric types
Costory’s query bar supports the metric types you need for formulas.- Cost metrics
- Usage metrics
- External metrics
Built-in billing metrics from your connected cloud providers. These include total cost, , list cost, and usage quantity.
Prerequisites
To build formulas from business or application activity, connect at least one usage metrics source. Supported sources include:- Datadog for infrastructure and application metrics
- Amplitude for product analytics such as DAU, MAU, and sessions
- BigQuery for warehouse-native metrics
- CSV or Google Sheets for manual imports
You can still use formulas without external metrics. Combine cost fields with usage metrics from billing data, such as cost per GB-Hour, without connecting another source.
Create a unit economics formula
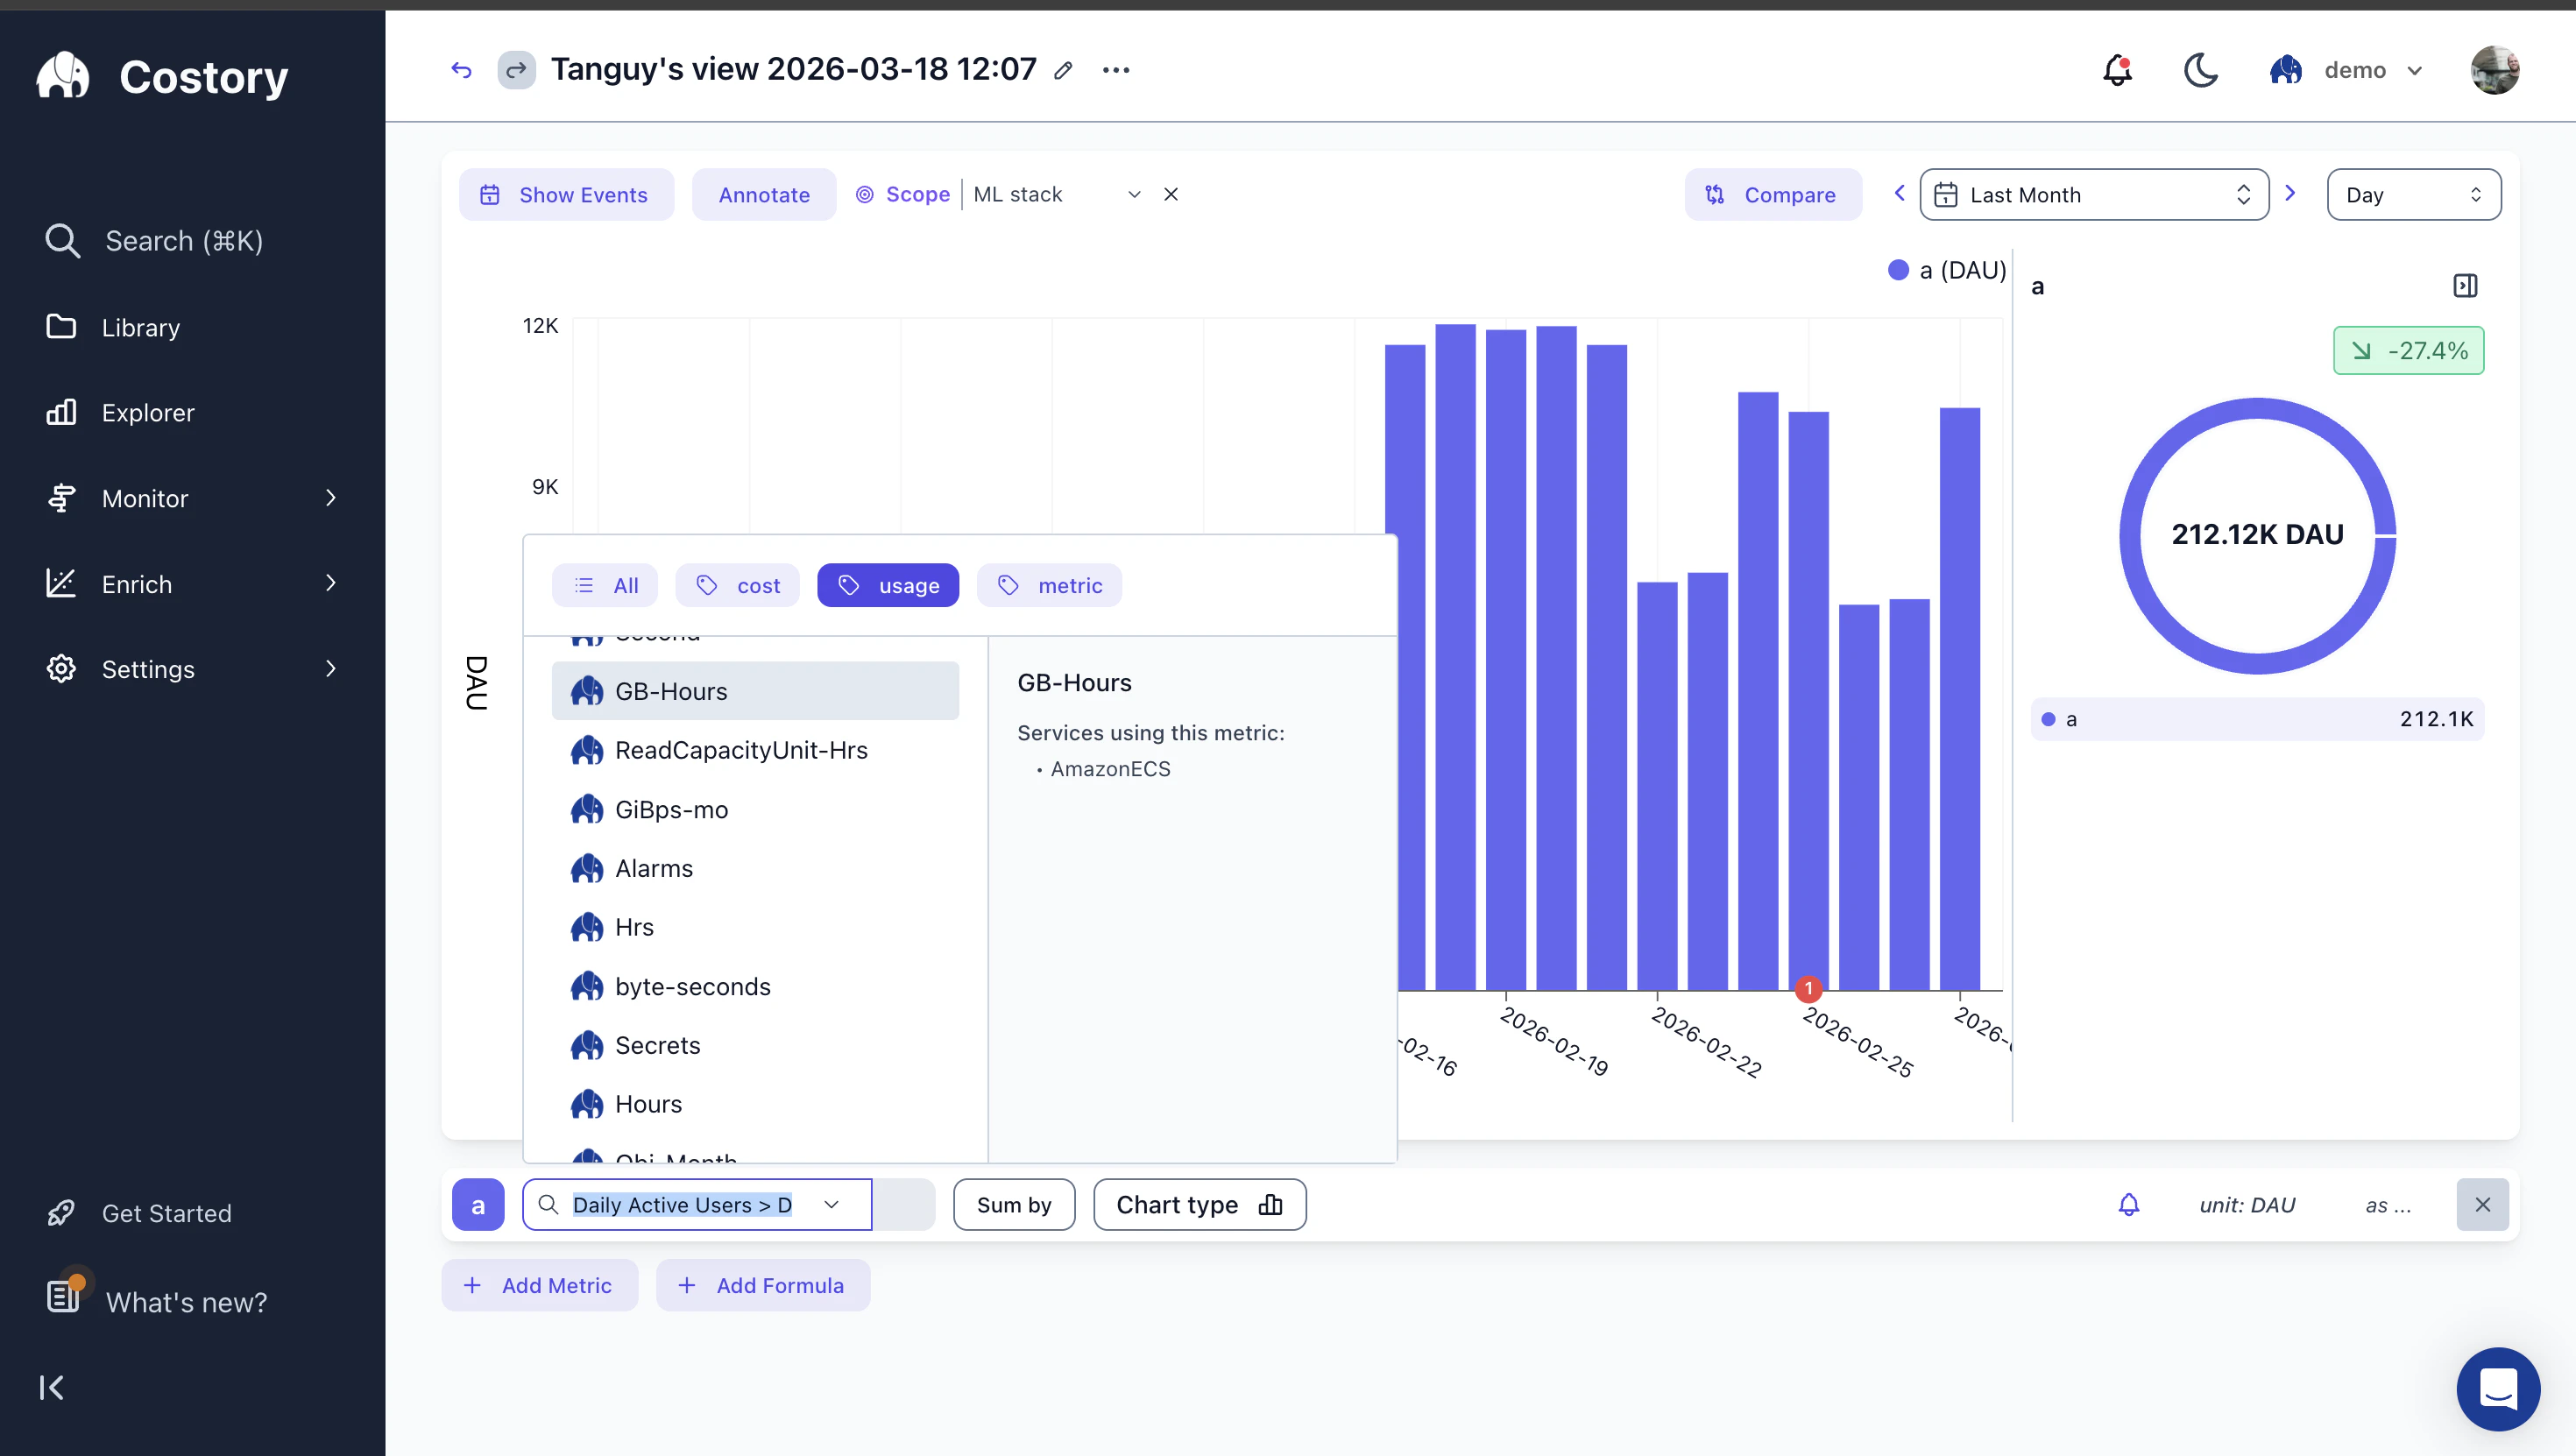
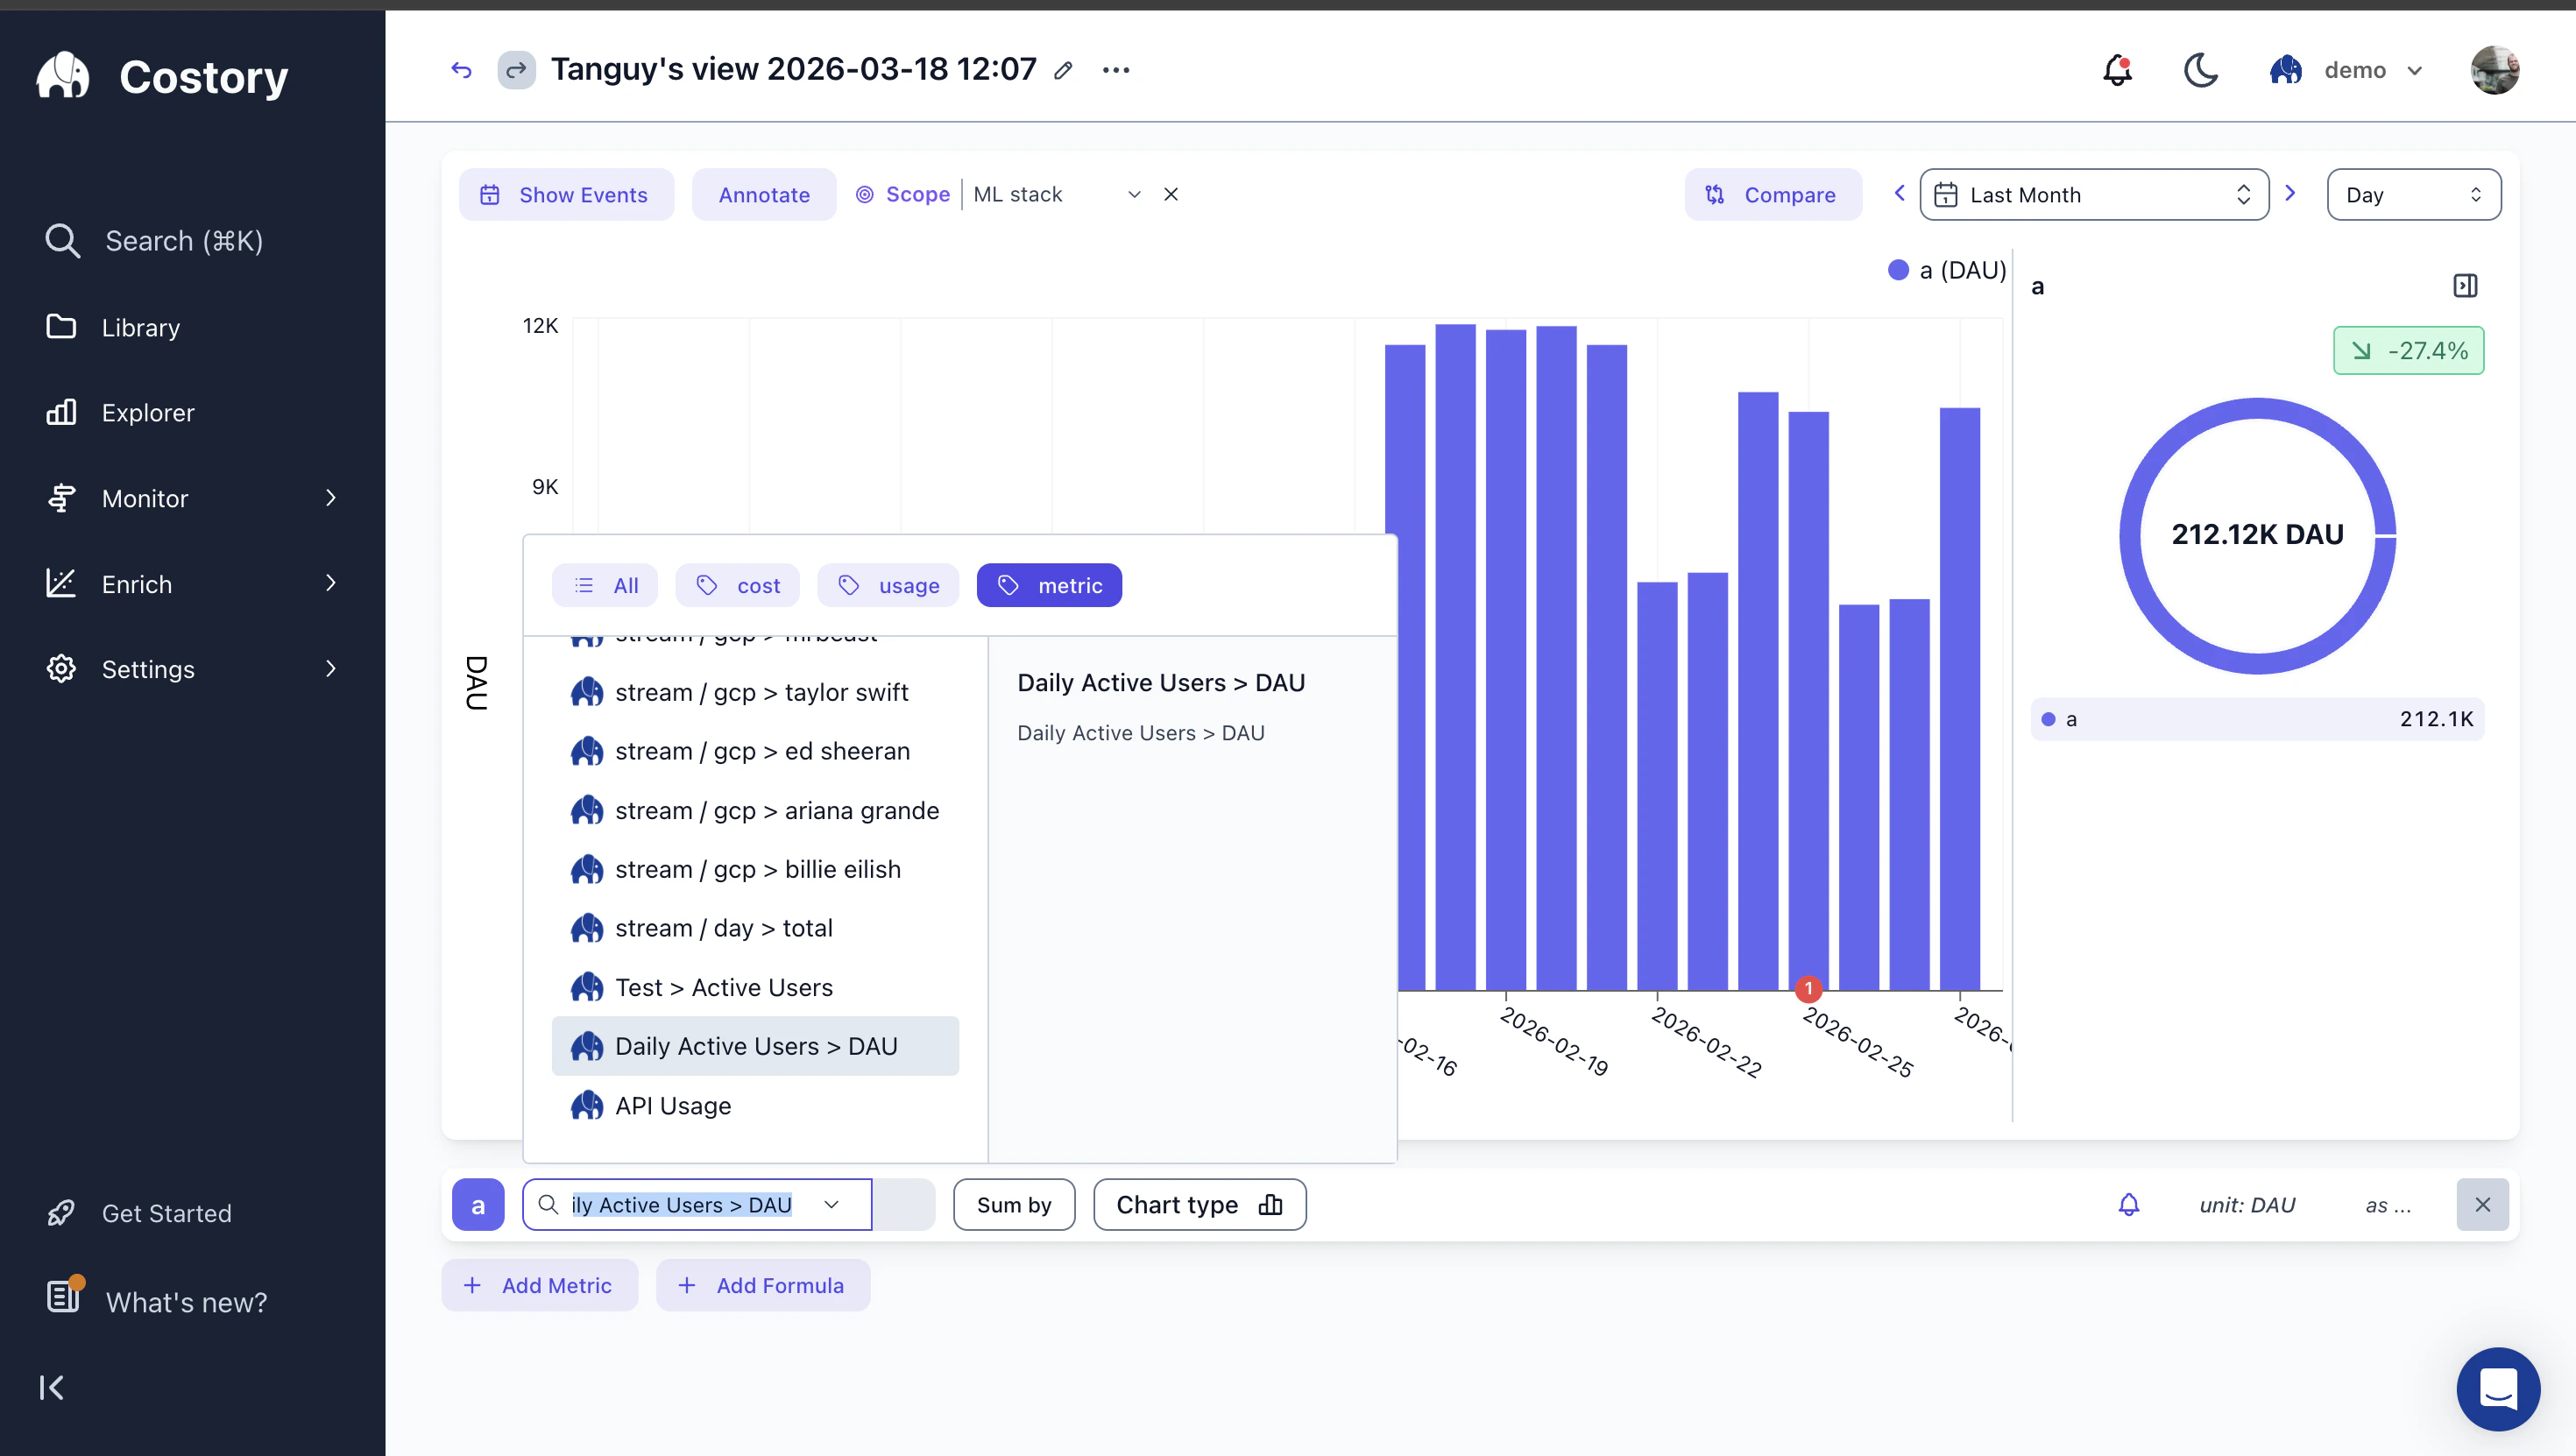
Open Explorer
Navigate to Explorer and configure the cost query you want to analyze.
Add metrics
Click + Add Metric in the query bar to add a cost metric, usage metric, or external metric. Each metric gets a letter label that you reference in formulas.
Add a formula
Click + Add Formula and write your formula with the metric labels.Examples: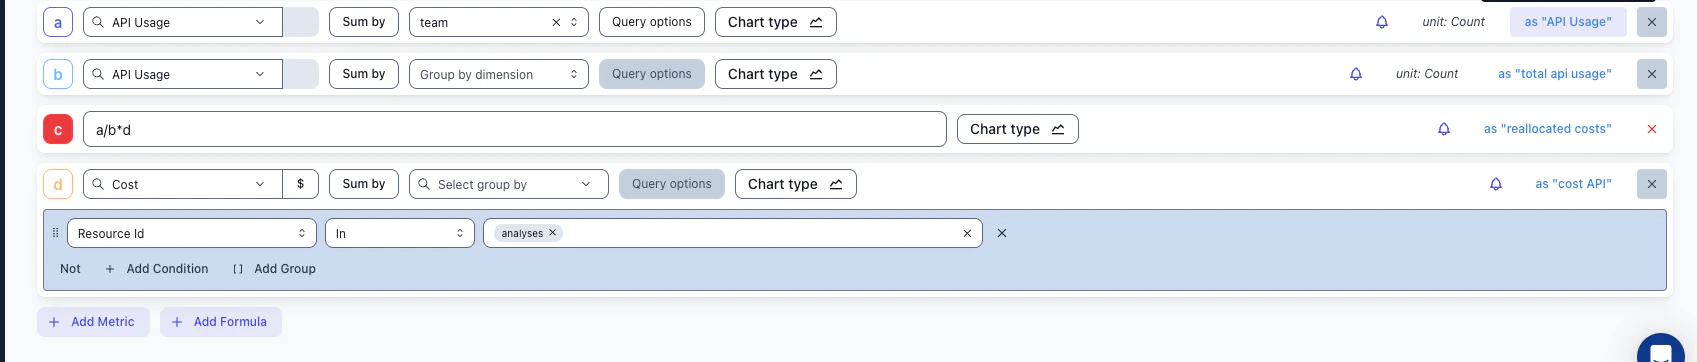
- If metric a is total cost and metric b is GB-Hours,
a / bgives you cost per GB-Hour. - If metric a is total cost and metric b is Daily Active Users,
a / bgives you cost per DAU.
Formulas support
+, -, *, /, and parentheses. For rolling averages or conditional logic, pre-compute the metric in your source system before importing it.Visualize the result
The chart updates to show the formula over time. Switch chart types and toggle between raw metrics and the formula output.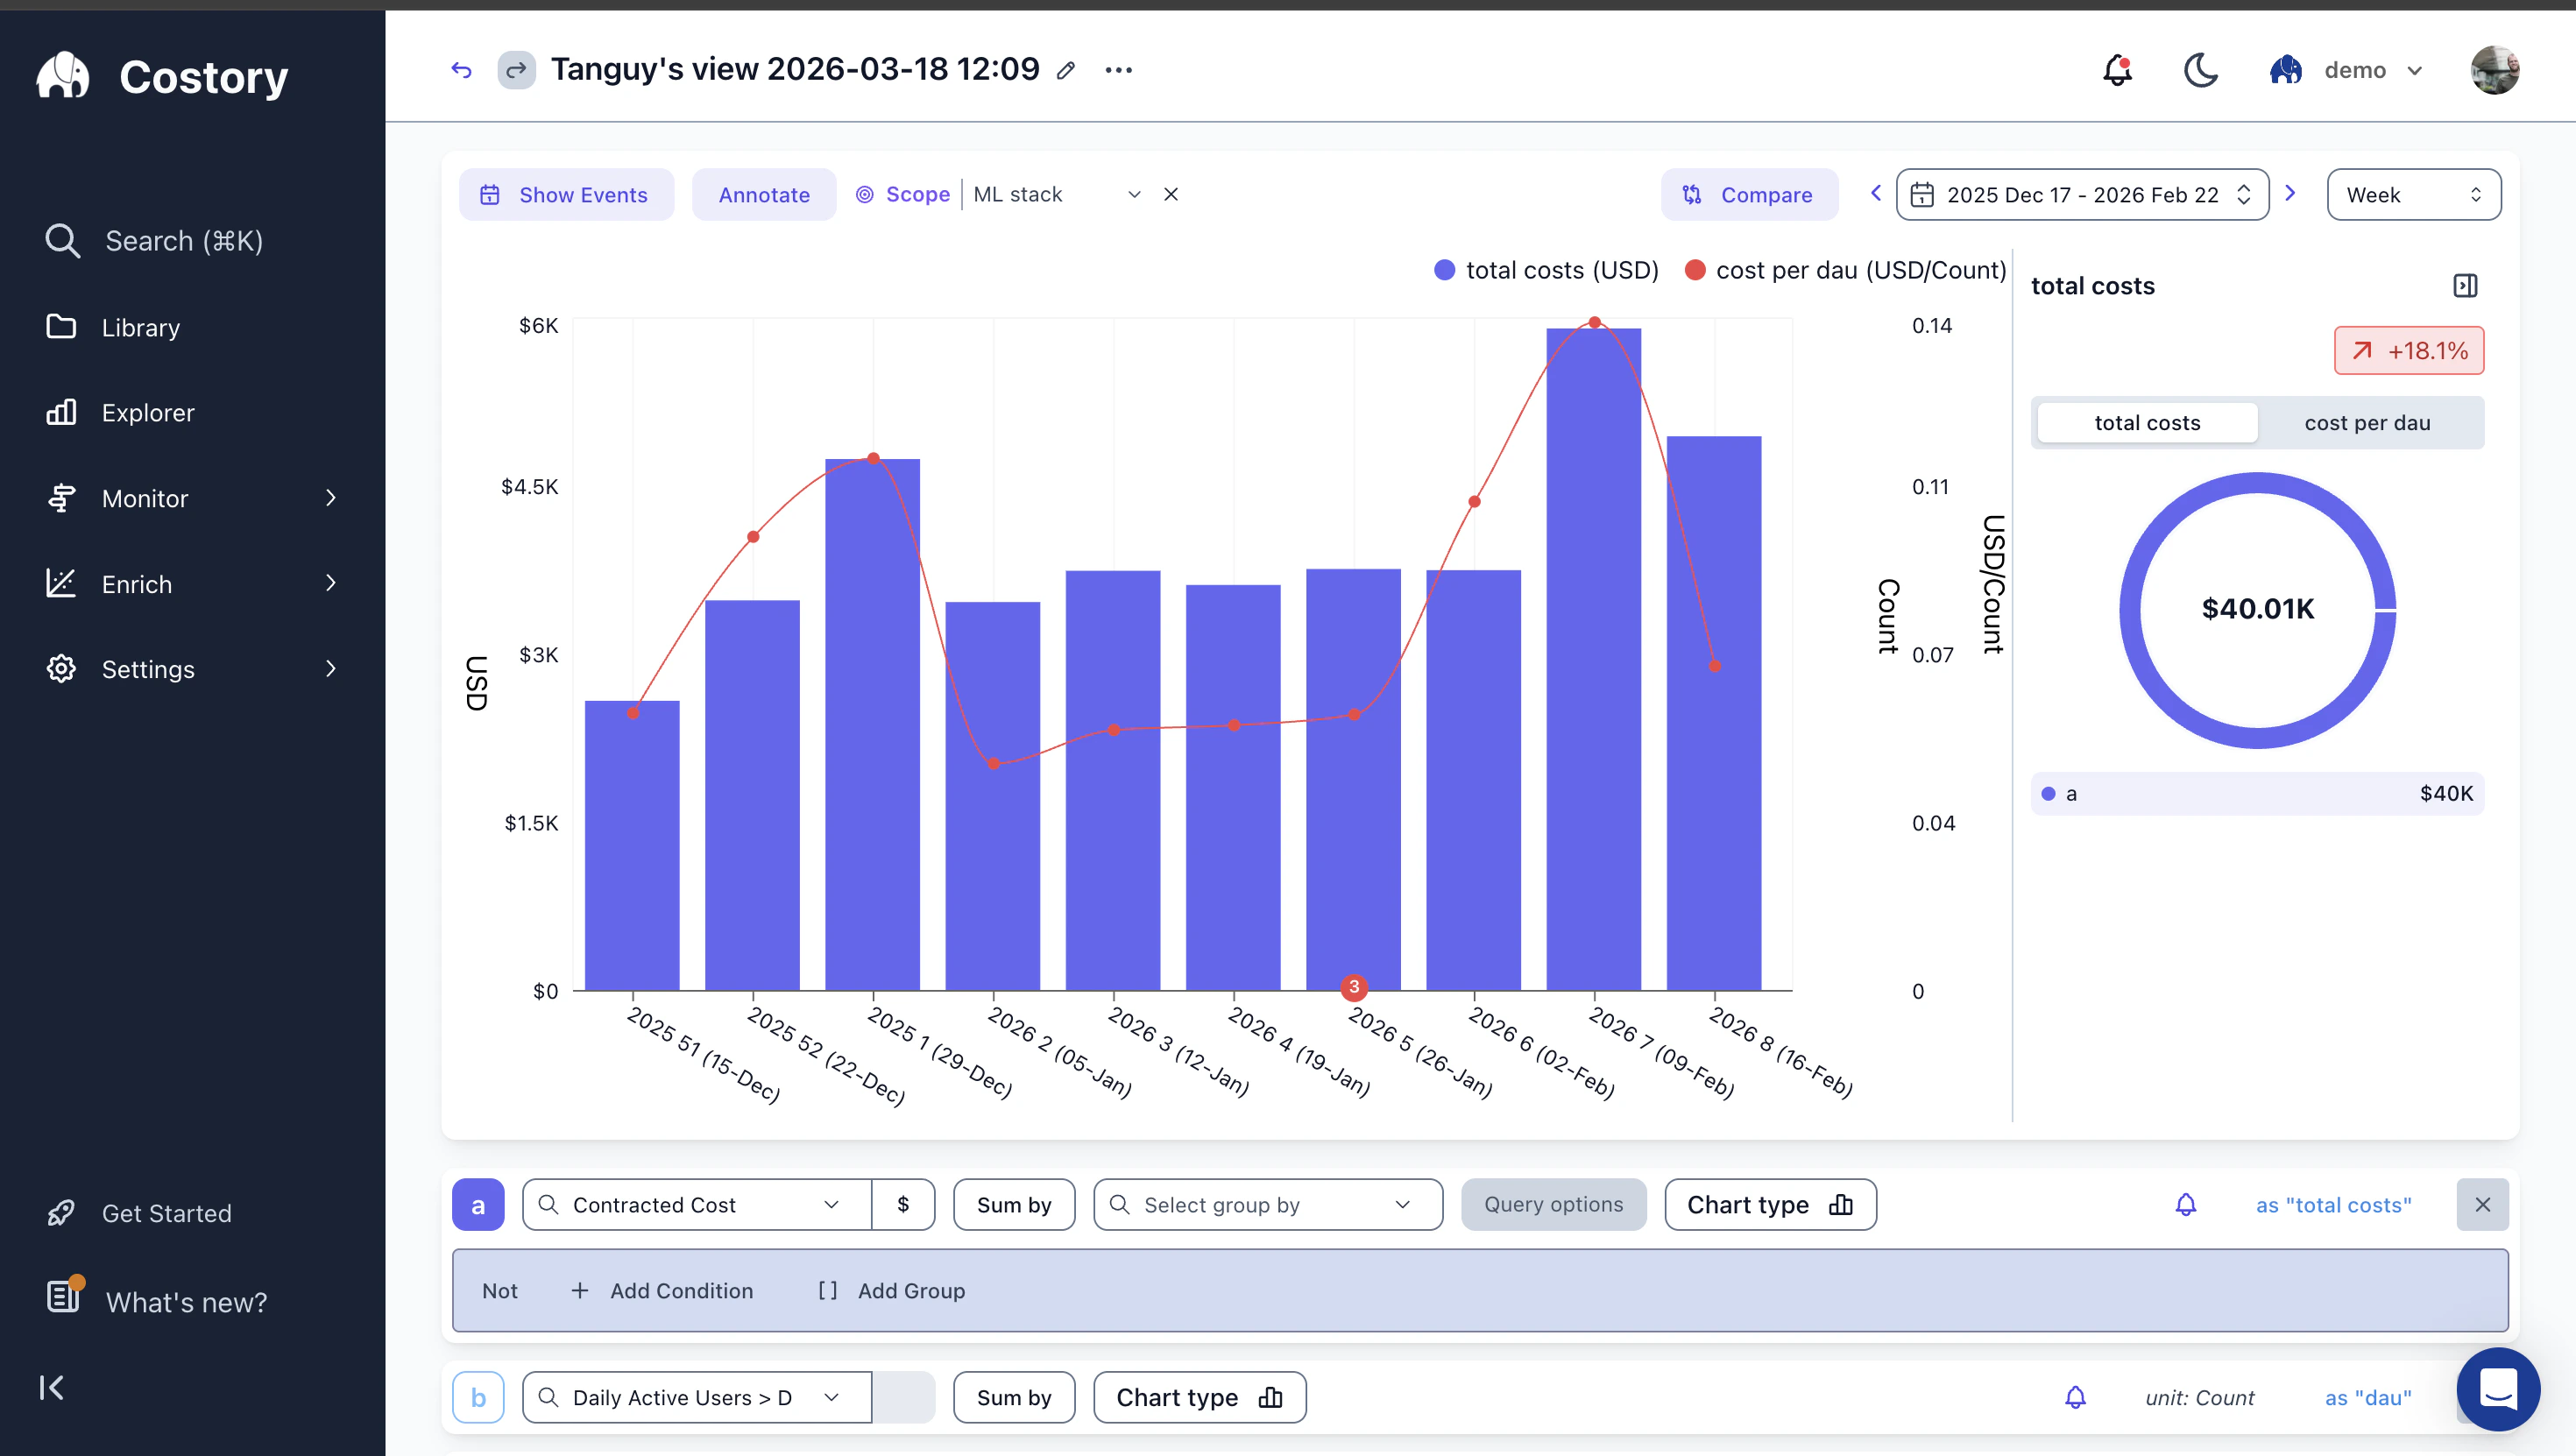
Save and share
Save the query as a dashboard widget so you can revisit it, share it with Quick Share, or schedule it as a Cost Report.
Frequently asked questions
How do I track cloud cost per user or per transaction?
How do I track cloud cost per user or per transaction?
Connect a usage metric such as DAU from Amplitude or transactions from your database. In Explorer, create a formula that divides cloud spend by that metric. For a full walkthrough, see cost per active user with Amplitude.
Do formulas work with group-by dimensions?
Do formulas work with group-by dimensions?
Yes. If you group by a dimension such as team or service, the formula is applied per group. This lets you compare unit economics across teams, services, or products.
What operators can I use in formulas?
What operators can I use in formulas?
Formulas support arithmetic operators (
+, -, *, /) and parentheses. Each metric is referenced by its letter label. Formulas operate on the aggregated value per time bucket.Can I alert on a unit economics metric?
Can I alert on a unit economics metric?
Yes. Save the formula and create an alert from it. Use this for targets such as cost per request, cost per active user, or cost per build minute.
Related links
Explorer
Build the base cost queries for unit economics.
Usage metrics setup
Connect business and application metrics.
Events
Add timeline context to cost changes.
Cost per active user
Follow a worked example with Amplitude.