| Costs | Users | Cost / 1k users | Verdict |
|---|---|---|---|
| +30% | +50% | ↓ | Scaling well |
| +30% | +30% | → | Flat, no gain, no loss |
| +30% | +10% | ↑ | Drifting, investigate |
- SaaS / Product: DAU or MAU.
- E-commerce: orders processed.
- Fintech: transactions processed.
- API platform: API requests.
- Marketing: campaigns or emails sent.
- Ad tech: impressions served or ad revenue.
- Data / Analytics: queries or pipelines executed.
- Streaming / Gaming: hours streamed or concurrent players.
What you’ll get
- A chart that overlays production costs with active users and cost per thousand users. Divergences are visible at a glance.
- Recurring Cost Reports showing cost and user trends side by side, without spreadsheet work.
- An alert that fires when your cost per thousand active users crosses a threshold you define.
Prerequisites
- Amplitude API credentials: API key + secret from Amplitude > Settings > Projects > [Your Project] > General. Used by the Metric Connector to pull daily active users into Costory.
- A production cost filter: a where clause in Explorer that isolates prod workloads. Exclude R&D, staging, and marketplace purchases, as they distort the unit cost calculation.
How to track cloud cost per active user
Import active users from Amplitude
Open the Metric Connector, enter your API key and secret.Set the aggregation to Average. You want the typical user count over the period, not a peak or a sum.Once imported, go to Data Sources > Metrics. You’ll see “Daily Active Users” listed with an Active status. Click the chart icon on that row to open the metric in Explorer. Your active users are loaded as query a.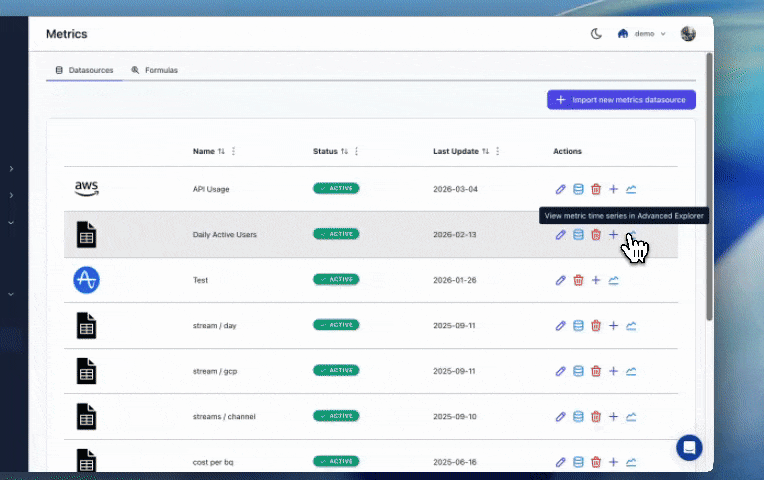
A metric can include one or more group-by dimensions (e.g., region, plan tier, team). When you add a group-by, Costory imports the metric broken down by that dimension, so you can later compute cost per thousand users per segment instead of only at the global level.
Not using Amplitude? Import from CSV, Google Sheets, Datadog, BigQuery, or S3 Parquet. Full list: Usage & Metrics Providers.
Build the cost per thousand users formula
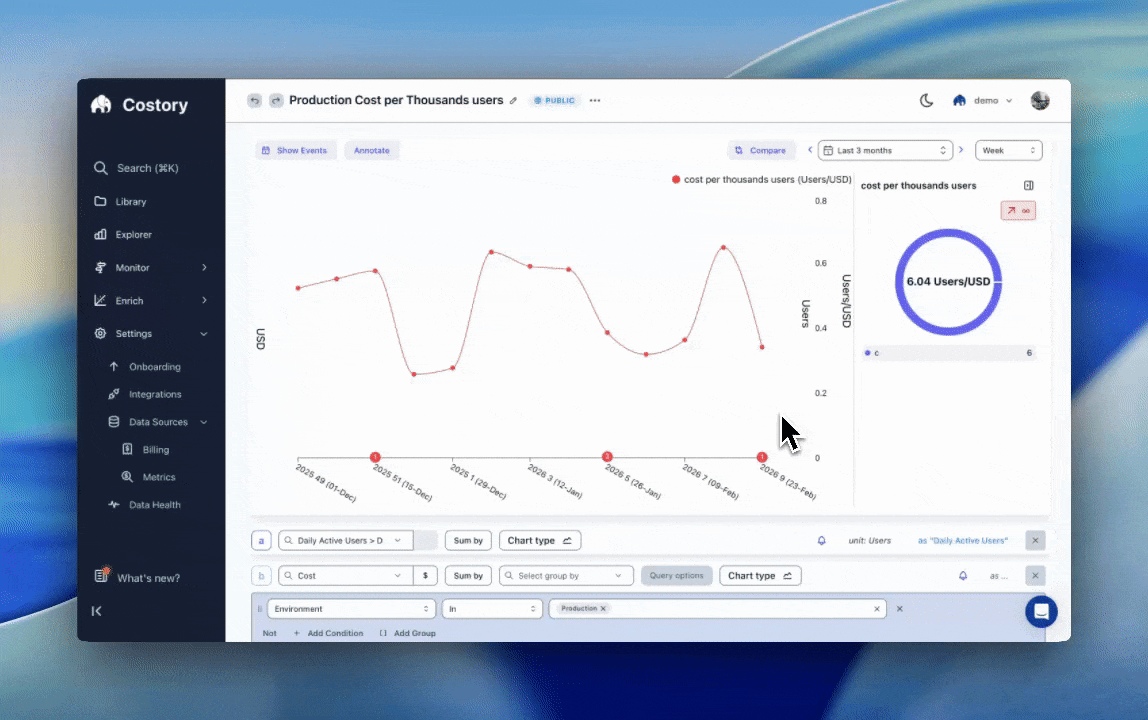
Your active users are already loaded as query a. Add a Cost query as query b, filtered to production, for example 
Environment in Production. Then add a formula b / (a / 1000) to get cost per thousand users. Dividing by 1,000 gives a more readable number than cost per individual user.Save as a view and schedule to Slack
Save as a , for example “Production Cost per Thousand Users”, and schedule weekly or monthly delivery to Slack.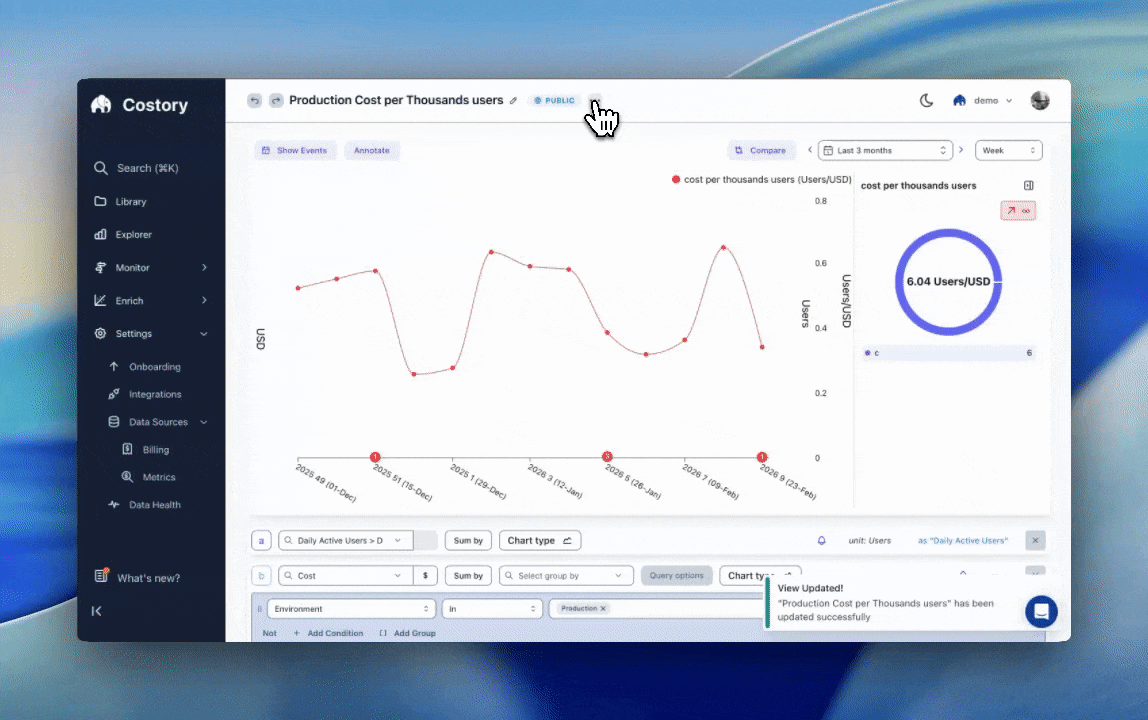
FAQ
Which business metric should I use for unit economics?
Which business metric should I use for unit economics?
Pick the metric that correlates most closely with your cloud spend. For most SaaS products, that’s daily or monthly active users. For e-commerce it may be orders processed, for API platforms it’s API requests, and for data platforms it’s queries executed. If the metric goes up and costs go up proportionally, you’ve found the right one.
Can I use this without Amplitude?
Can I use this without Amplitude?
Yes. Costory’s Metric Connector supports CSV, Google Sheets, Datadog, BigQuery, S3 Parquet, and more. See Usage & Metrics Providers for the full list.
How often does the Amplitude metric sync?
How often does the Amplitude metric sync?
Costory syncs Amplitude data daily. The metric updates automatically so your cost-per-user ratio stays current without manual intervention.
Should I use Average or Sum for the aggregation?
Should I use Average or Sum for the aggregation?
Use Average for user counts. It gives you the typical user count over the period rather than a peak or cumulative total. Use Sum for volume-based metrics like API requests or transactions processed.
Next steps
Cost Reports
Send weekly or monthly cost reports to your team channels.
Explore cost drivers
Drill into cost spikes and validate trends across services.
Improve tagging
Clean up labels and boost attribution accuracy.