Prerequisites
- Your cloud billing data is connected to Costory (see Quickstart).
- Optionally, events (deploys, incidents, provider changes) are connected so the AI can reference them in its explanations.
What you get
- An automated monthly cost breakdown in a tree format, highlighting the biggest movers.
- AI-generated root-cause explanations for each significant change.
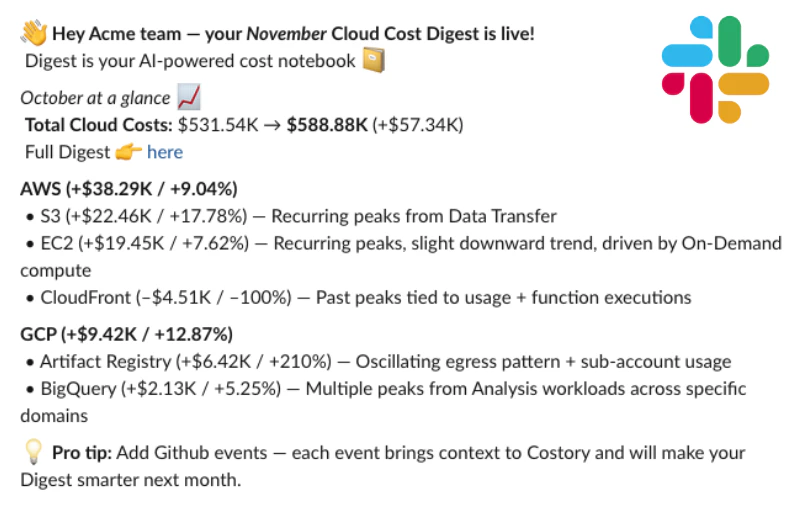
- An executive summary ready to share via Notion, Slack, PowerPoint, or email.
How to automate monthly cost reporting step by step
Open the Digest
Go to the Digest and select the month you want to report on.The Digest breaks down your monthly costs into an intuitive tree format, highlighting the nodes that moved the most.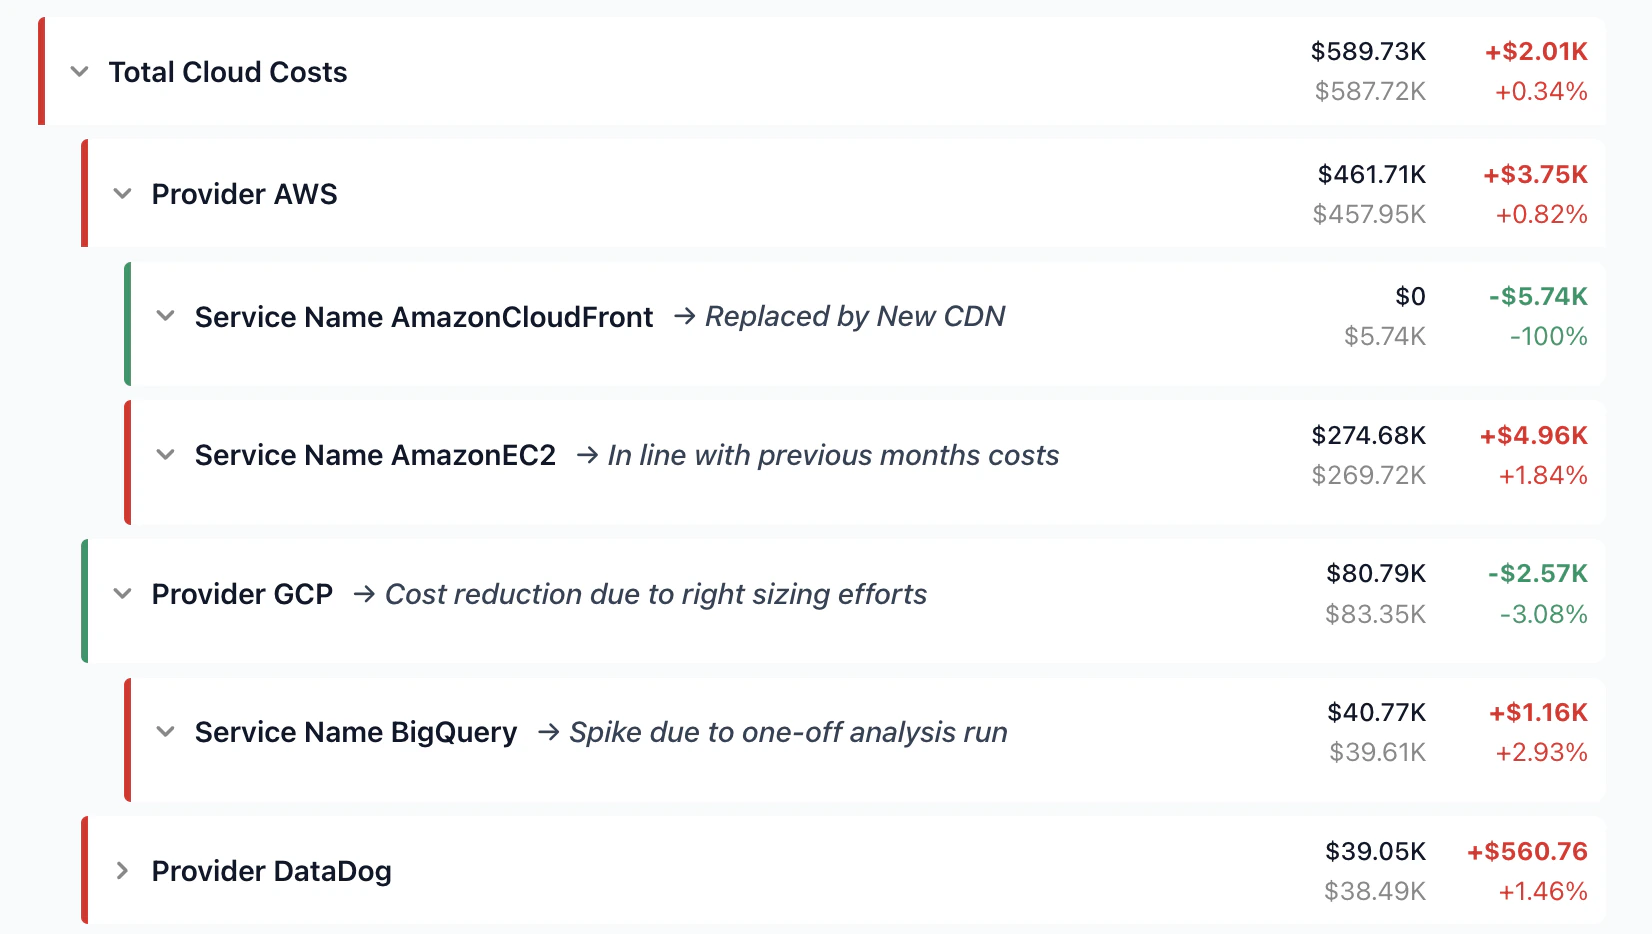
Review AI-generated explanations
For each node in the tree, Billy (Costory’s AI FinOps assistant) analyzes billing data, usage trends, and incident history to explain what changed and why.Billy spots anomalies, traces them to root causes, and outputs a structured explanation you can annotate with your own context before sharing.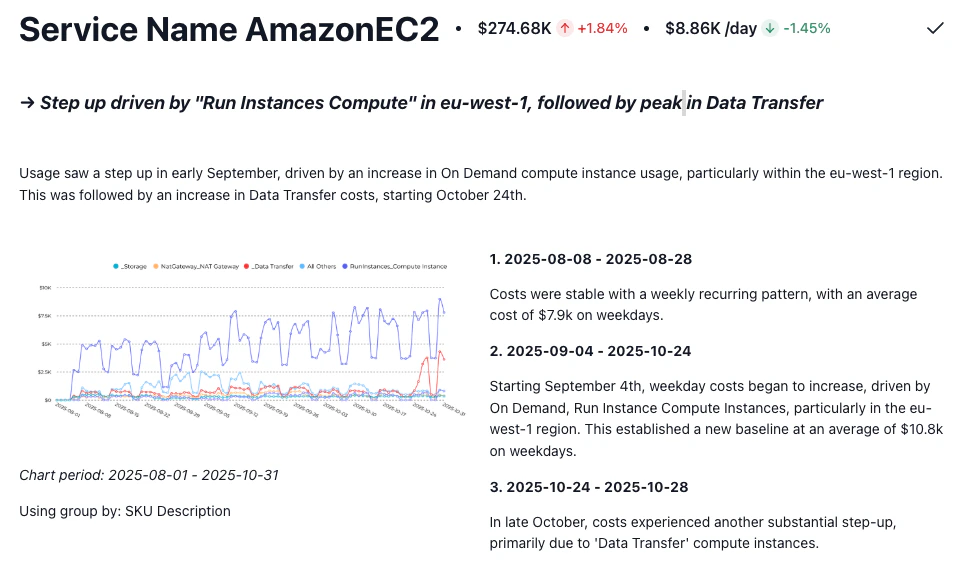
Next steps
- Add context to your reports: Connect events (deploys, incidents, provider changes) so Billy can reference them in its explanations.
- Relate costs to usage: Import usage metrics to show that cost increases track with business growth. See Relate Costs to Usage.
- Share per-team reports: Use Cost Reports to give each squad visibility into their own costs. See Decentralize FinOps.