Prerequisites
- You have a Kubernetes cluster running (AWS EKS or GCP GKE).
- You have a provider connected to Costory with your billing data ingested.
- You have labels / tags applied (or plan to apply them) to your pod deployments.
Azure AKS support is coming soon.
Output
- Granular cost visibility at the Kubernetes label level (team, app, environment, etc.) without any third-party agent.
- Ability to track waste ratio per node pool and identify over-provisioned clusters.
- Foundation for cost allocation and chargeback across teams.
How waste is defined in Kubernetes
In Kubernetes, your pods request a certain amount of CPU, memory, and GPU. The scheduler then decides on which node(s) to run your pods. Two concepts matter here:- Requests: the amount of resources reserved by the pod. The scheduler uses this to pick the right node(s).
- Limits: the maximum resources a pod can consume before getting killed by the kernel (OOM killer).
Example
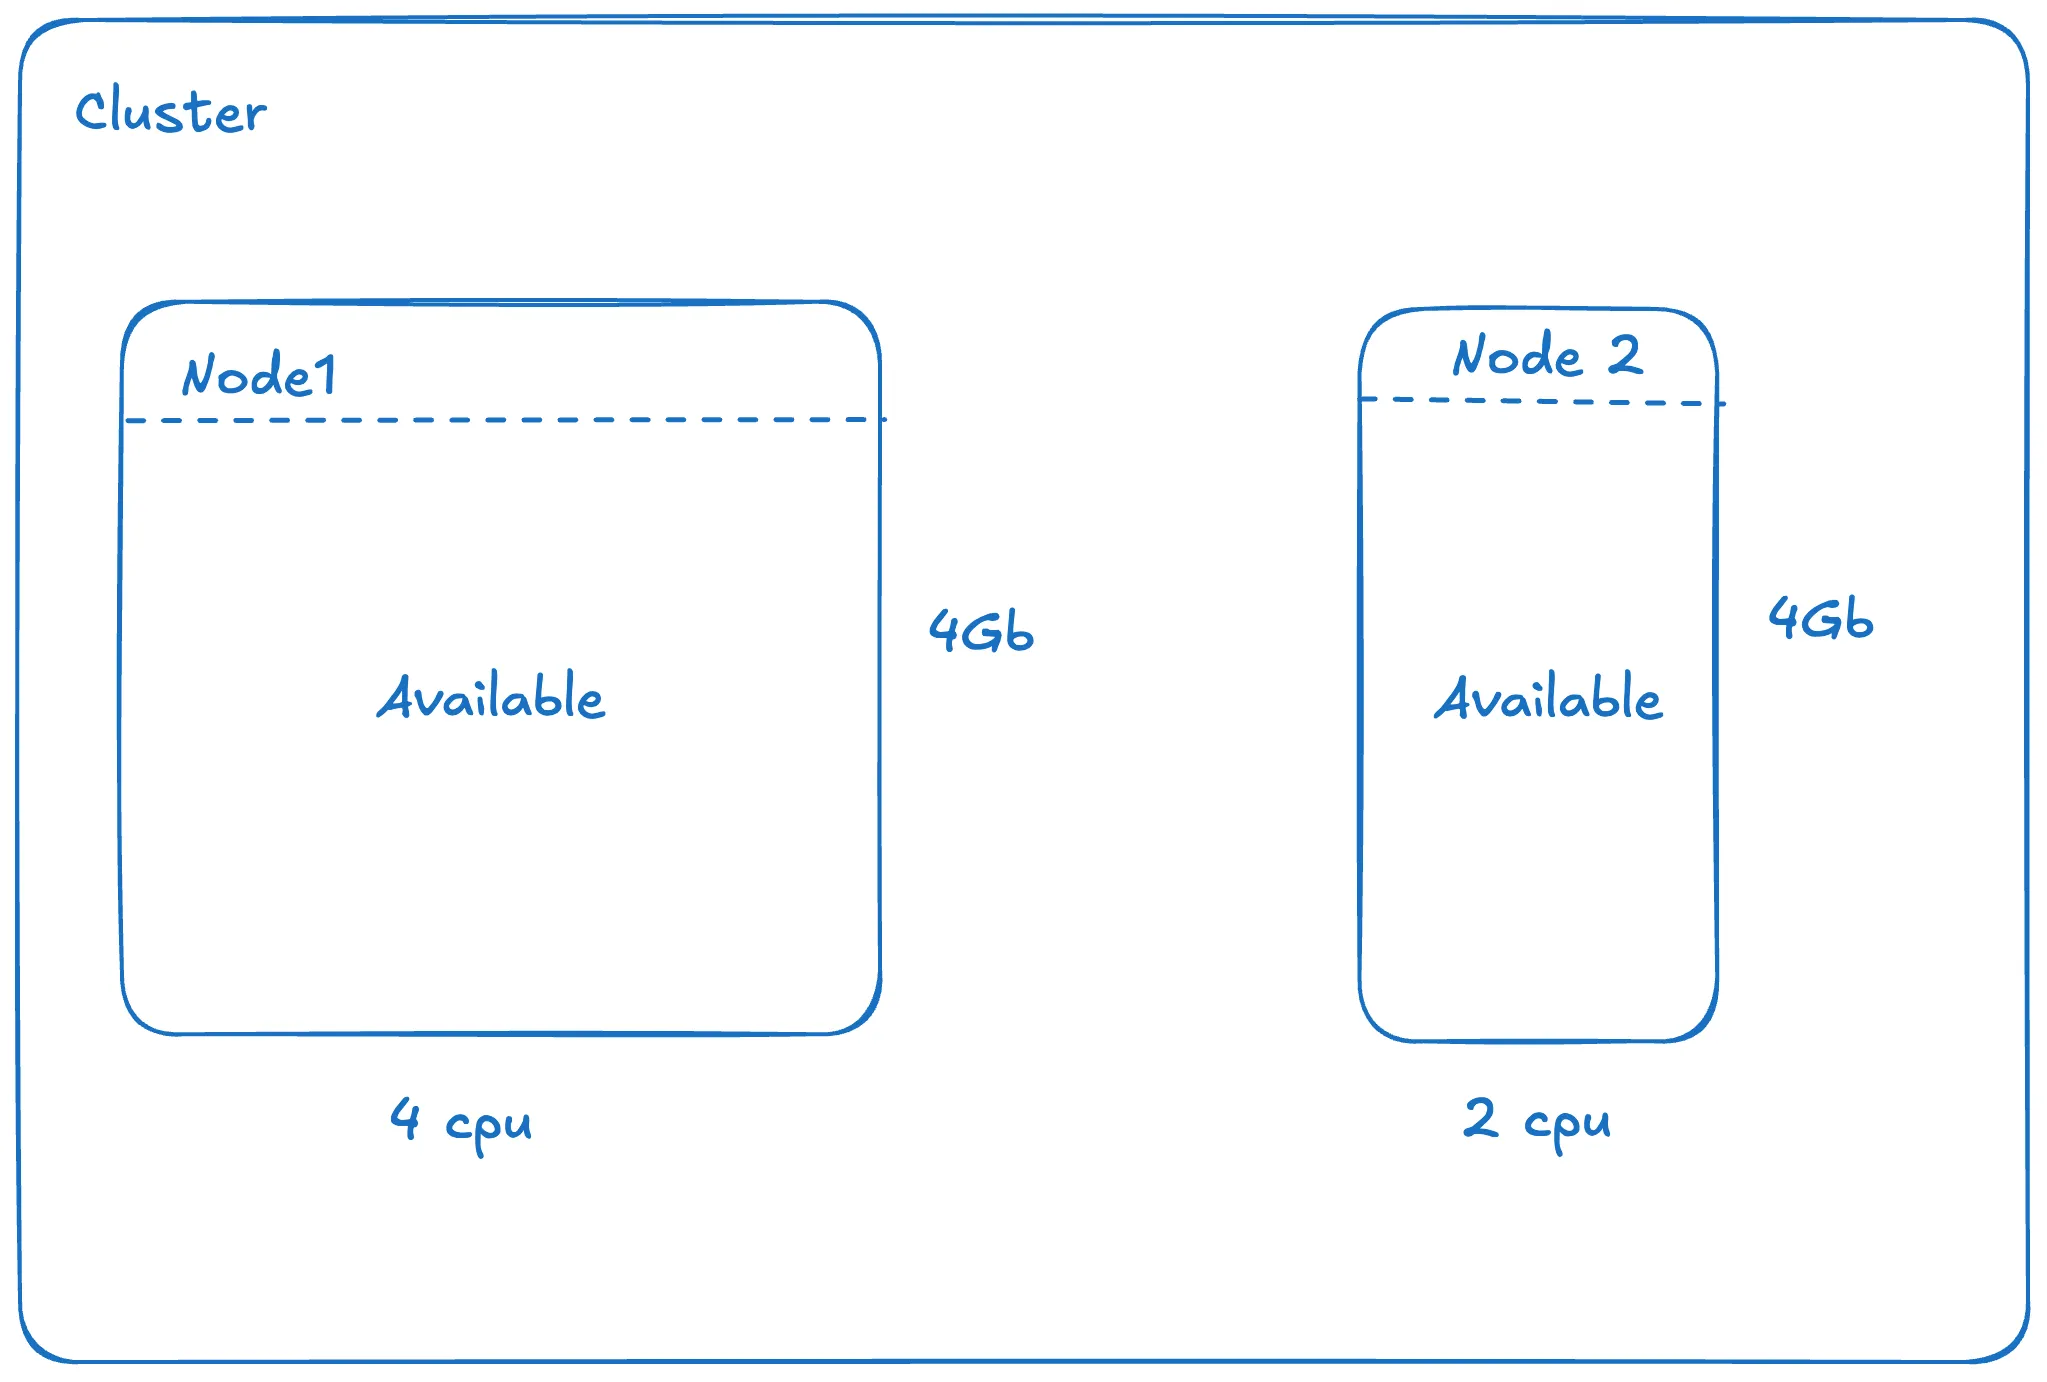
Consider a cluster with two nodes and three pods:| CPU | Memory | |
|---|---|---|
| Node 1 (available) | 2 CPU | 4 GB |
| Node 2 (available) | 4 CPU | 4 GB |
| Total available | 6 CPU | 8 GB |
| CPU request | Memory request | |
|---|---|---|
| Pod 1 | 1 CPU | 2 GB |
| Pod 2 | 1 CPU | 2 GB |
| Pod 3 | 1 CPU | 1 GB |
| Total requested | 3 CPU | 5 GB |
Converting waste to cost
Since you pay per machine (not per core or per GB), we need a ratio to split the cost between CPU and memory. We use a 9:1 ratio in favor of CPU. This reflects that, on most AWS and GCP instance families, CPU is roughly 9x more expensive per unit than memory. You can verify this by comparing on-demand pricing for common instance types. From there, it’s useful to compute waste at two levels:- Cluster level: get an overall view of waste.
- Node pool level: if you rely on affinity rules, this helps identify which node pools are underutilized.
Steps
Set up label visibility
- AWS EKS
- GCP GKE
Follow the EKS cost allocation guide to enable split cost allocation and add labels to your pod deployments.
Break down costs by label
Once your pods have labels, such as team, app, and environment, use Costory Dimensions to merge these labels with your billing data. This lets you split cluster costs per label for cost allocation and chargeback.This allows you to fix the automatic renaming performed by GCP (
k8s_label_<label_name>).Monitor the waste over time
Track your waste ratio over time and get notified when it exceeds acceptable thresholds. In Costory, create an alert using the Kubernetes Waste template:
Reallocate waste to teams
Waste reallocation is currently available for EKS only.
| Strategy | How it works | Best for |
|---|---|---|
| Namespace reallocation (default) | Calculates per-hour usage requested by each namespace and reallocates waste proportionally. | Most clusters with standard scheduling. |
| Node-based reallocation | Calculates per-hour resource requests per pod on each individual node and reallocates waste accordingly. A pod alone on a node will bear its full cost for the period it’s the sole occupant. | Clusters relying heavily on affinity rules (node pools, zones, etc.) where a single pod may trigger a new node. Trade-off: more variance in waste over time. |
What’s next?
- Set up a weekly Slack report to share waste metrics with your team.
- Add your Kubernetes labels to the digest tree for automated cost-change notifications.
- Explore your data in Explorer to identify faulty deployments over-requesting resources.