
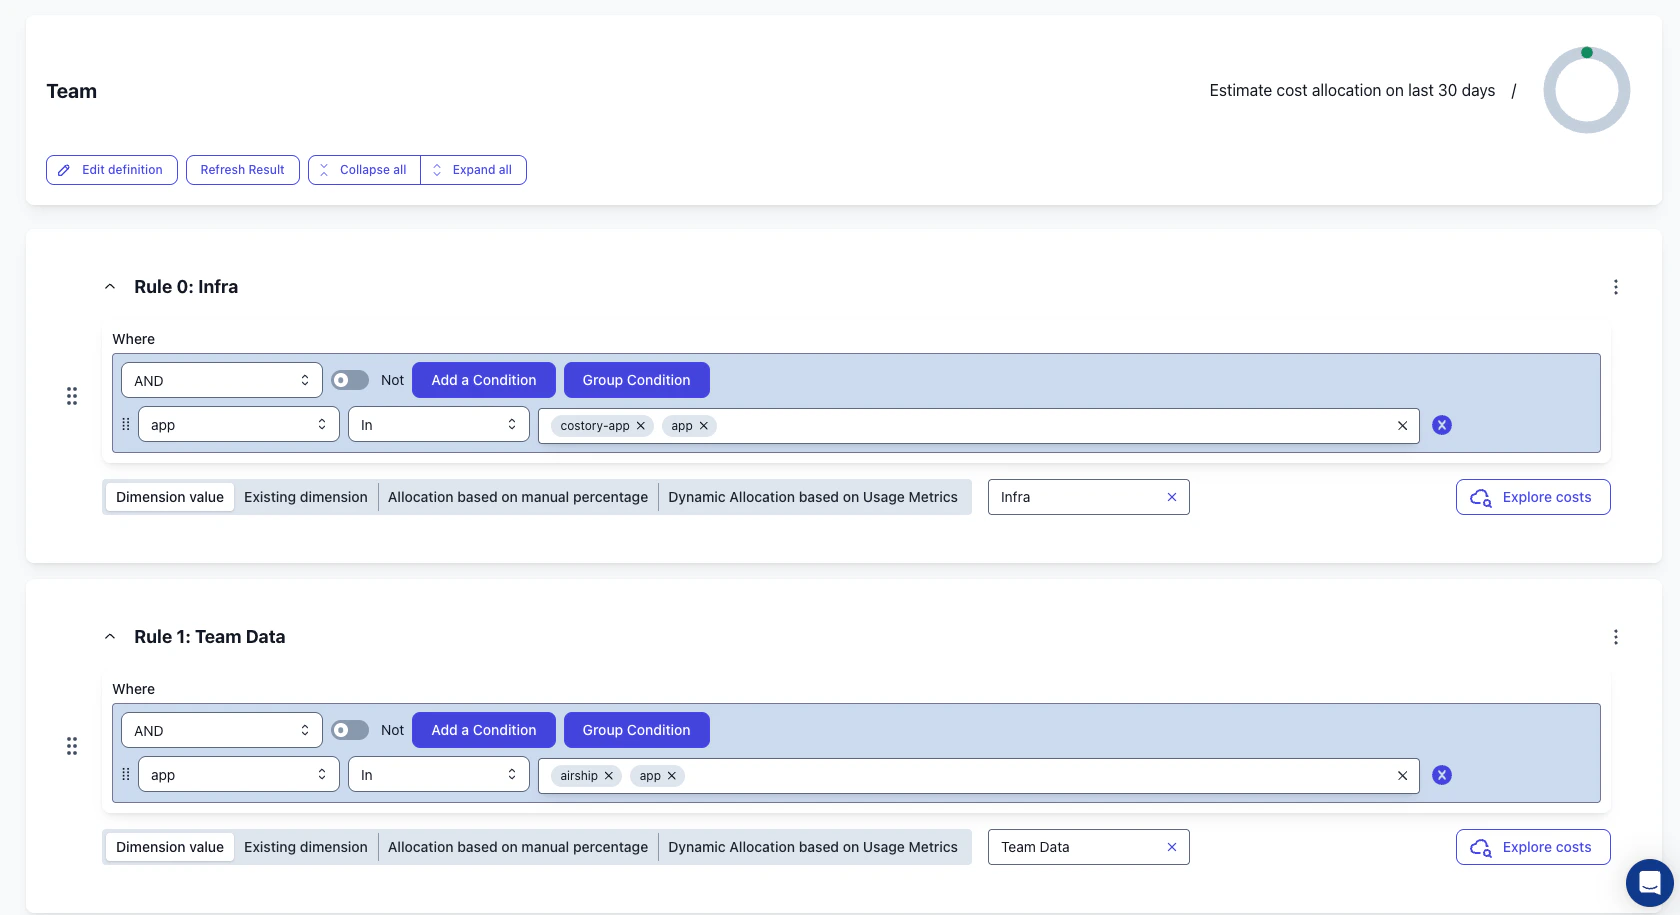
Prerequisites
- You have an AWS EKS cluster running.
- You have an AWS provider connected to Costory with your data ingested.
- You have labels or tags applied to your pod deployments, or you plan to add them.
- For Kubecost or OpenCost, you can export allocation data to a shared S3 bucket that Costory can access.
Output
- Granular cost visibility at the Kubernetes label level, including team, app, environment, namespace, and cluster.
- A clear choice between request-based, usage-based, and OpenCost-backed allocation.
- Ability to track per node pool and identify over-provisioned clusters.
- Foundation for and across teams.
- Stable cost data using Contracted Cost, so Savings Plan reassignments between clusters do not create false cost spikes.
Choose an EKS cost allocation method
Pick the method that matches the allocation signal you trust most: Kubernetes requests, measured CPU and memory usage, or OpenCost allocation data.If you are starting from scratch, start with AWS . Add usage metrics or OpenCost data only when requests are too coarse or network allocation is material.
Recommended labels for EKS chargeback
Start with a small label set that answers who owns the workload, what it runs, and where it runs. You can add more labels later, but these fields cover most EKS workflows.
Use consistent lowercase values. Avoid aliases like
prod, prd, and production unless you plan to normalize them in .
Set up your chosen EKS cost allocation method
1
Configure the allocation data source
- AWS Split Cost Allocation
- AWS-managed usage metrics
- Kubecost or OpenCost
AWS Split Cost Allocation adds pod-level cost records to your . Kubernetes custom labels for EKS became available as cost allocation tags in October 2025, so you can attribute EKS costs by business labels such as team, application, and environment.
- Go to the AWS Cost and Usage Report settings.
- Follow the AWS guide for enabling split cost allocation data.
- Include resource IDs and use hourly reports when you need the most granular data.
- Activate the relevant in the Billing console.
2
Add labels to pod deployments
Add labels that reflect ownership and purpose to each Kubernetes workload:Use the same label keys across clusters. If teams already use different names, such as
owner, team, and cost_center, keep them for now and merge them later in Costory.3
Wait for data to flow into Costory
After configuring AWS , wait 2-3 days for the data to appear in your Cost and Usage Report and flow into Costory.For Kubecost or OpenCost, the delay depends on your export schedule and the Costory ingestion cadence for the shared S3 bucket.
4
Validate labels in Costory
Before you build dashboards or views, check that your labels are present and populated:
- Open .
- Filter to your AWS account and EKS services.
- Group by one label, such as
teamorapp. - Check the
nullor unallocated bucket. - Fix missing labels at the deployment level, then wait for the next billing export or OpenCost export.
k8s_label_team, team, and owner into one reporting field.Analyze EKS costs in Costory
Once EKS labels appear in Costory, use them to find waste, build team reporting, and share cost changes.Find waste by node pool
Use to group by node pool and spot clusters with unusually high waste.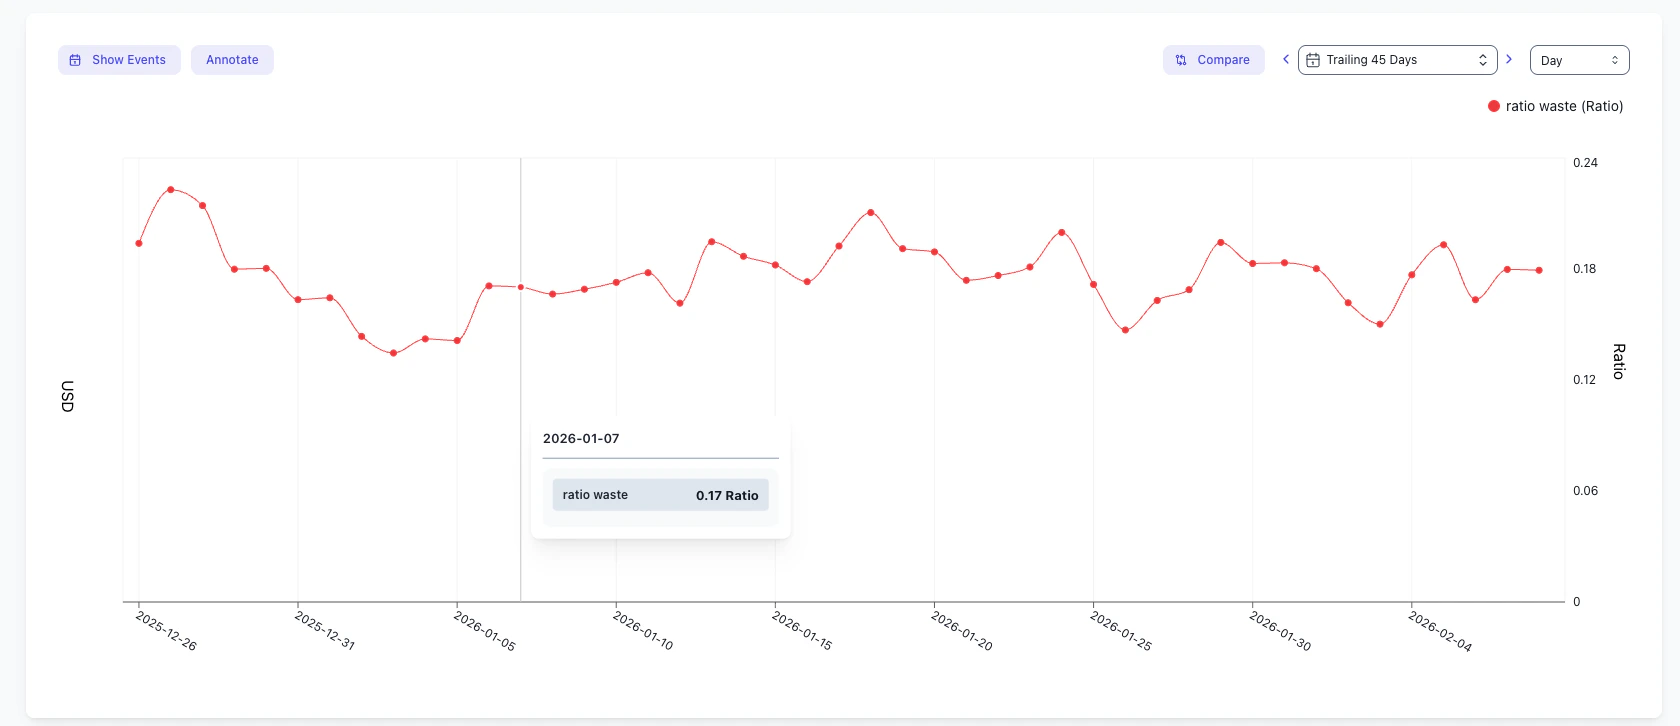
Identify over-requesting deployments
For native split allocation, sort by requested CPU or memory to find workloads that reserve more capacity than they use.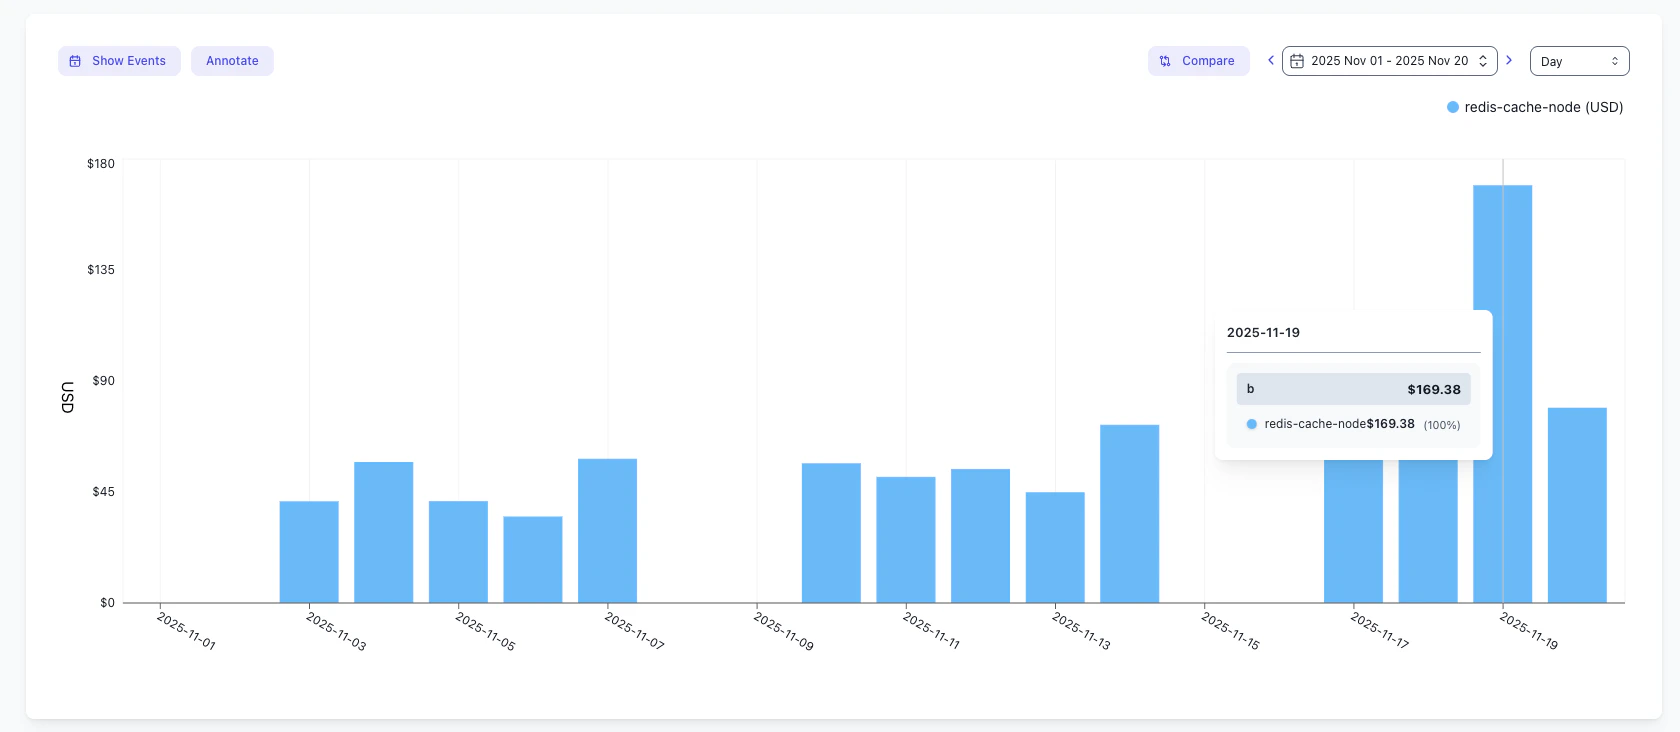
Share recurring updates
Turn any saved view into a and send it to your team.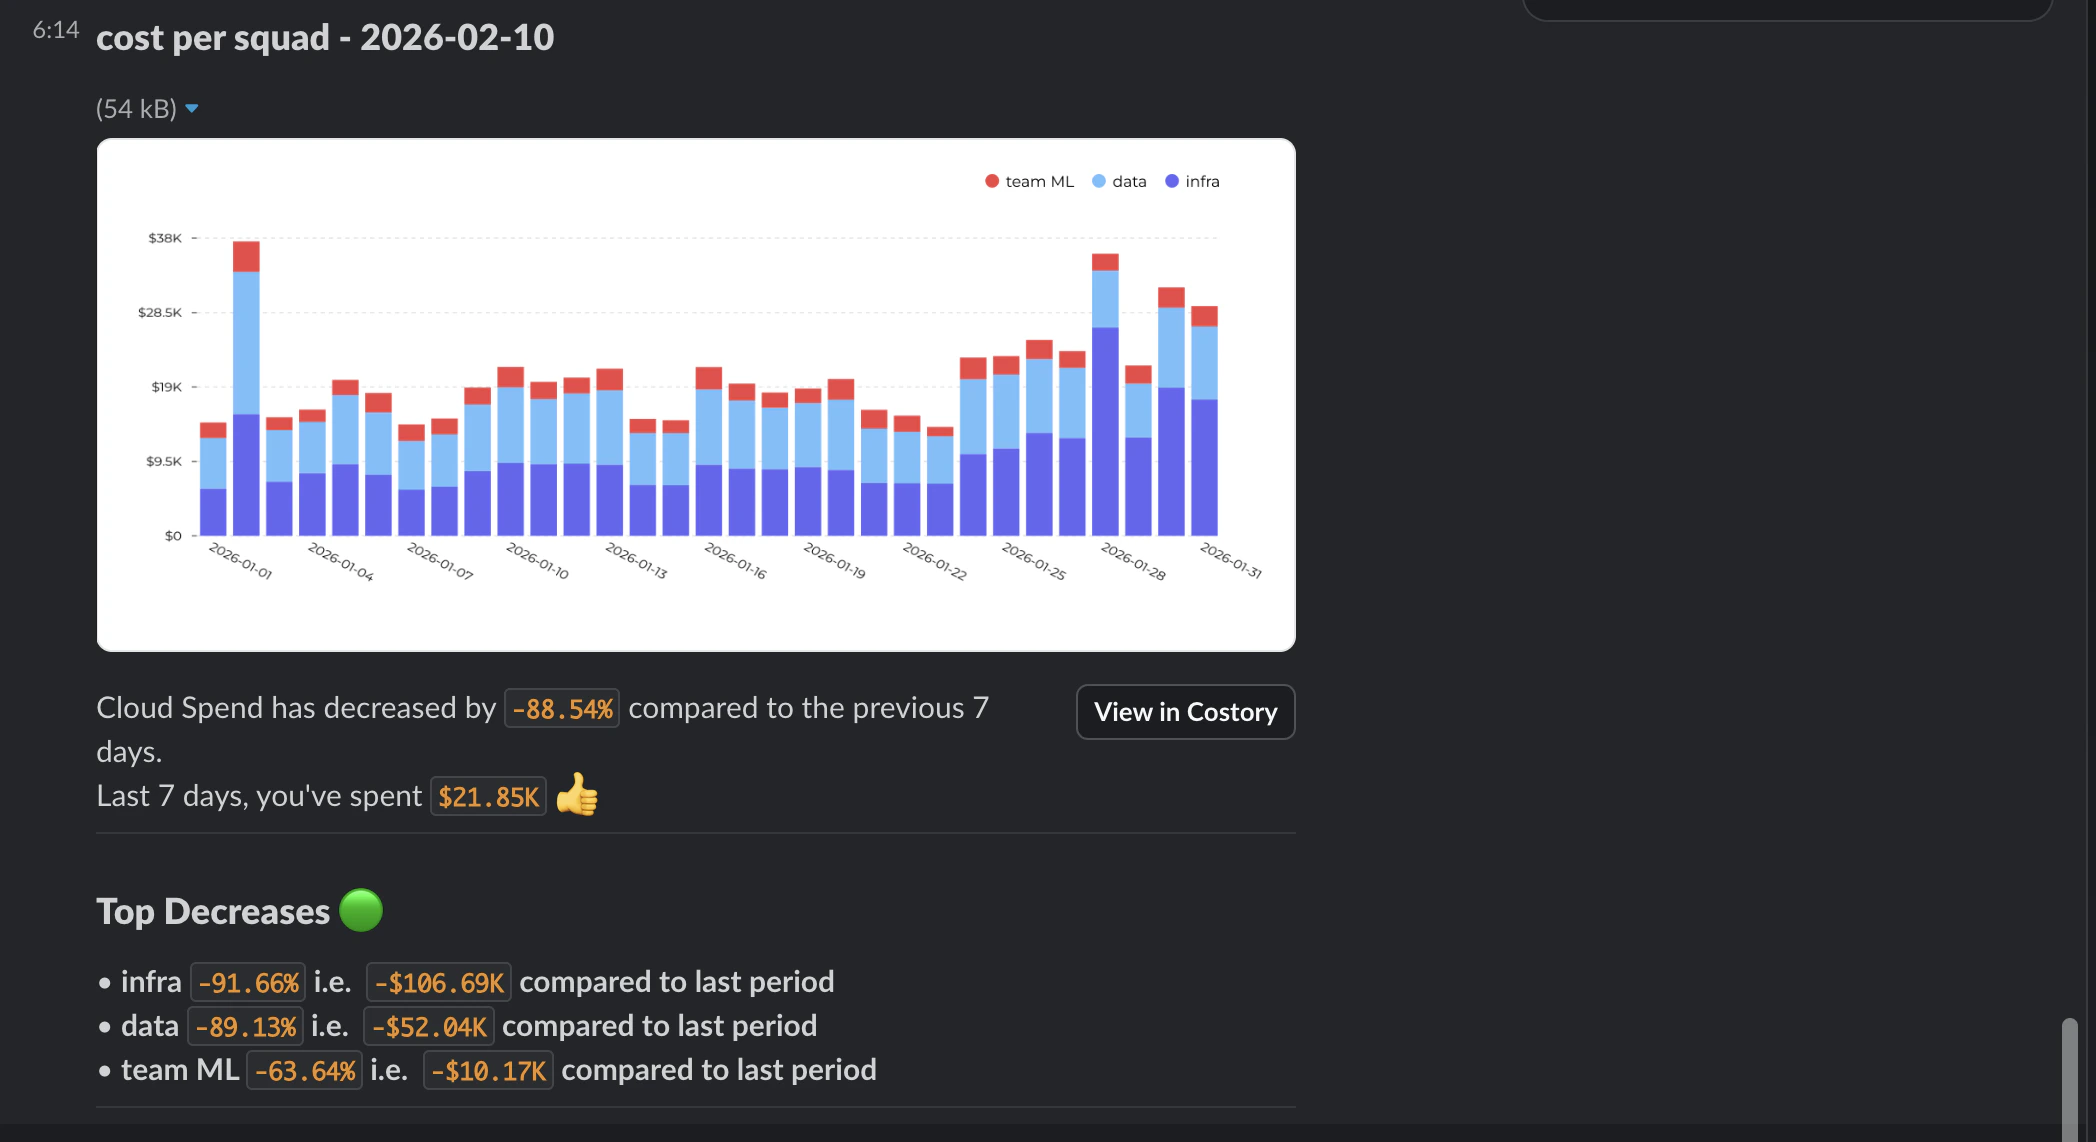
Surface cost changes in Digest
Add your Kubernetes labels to the so highlights what changed.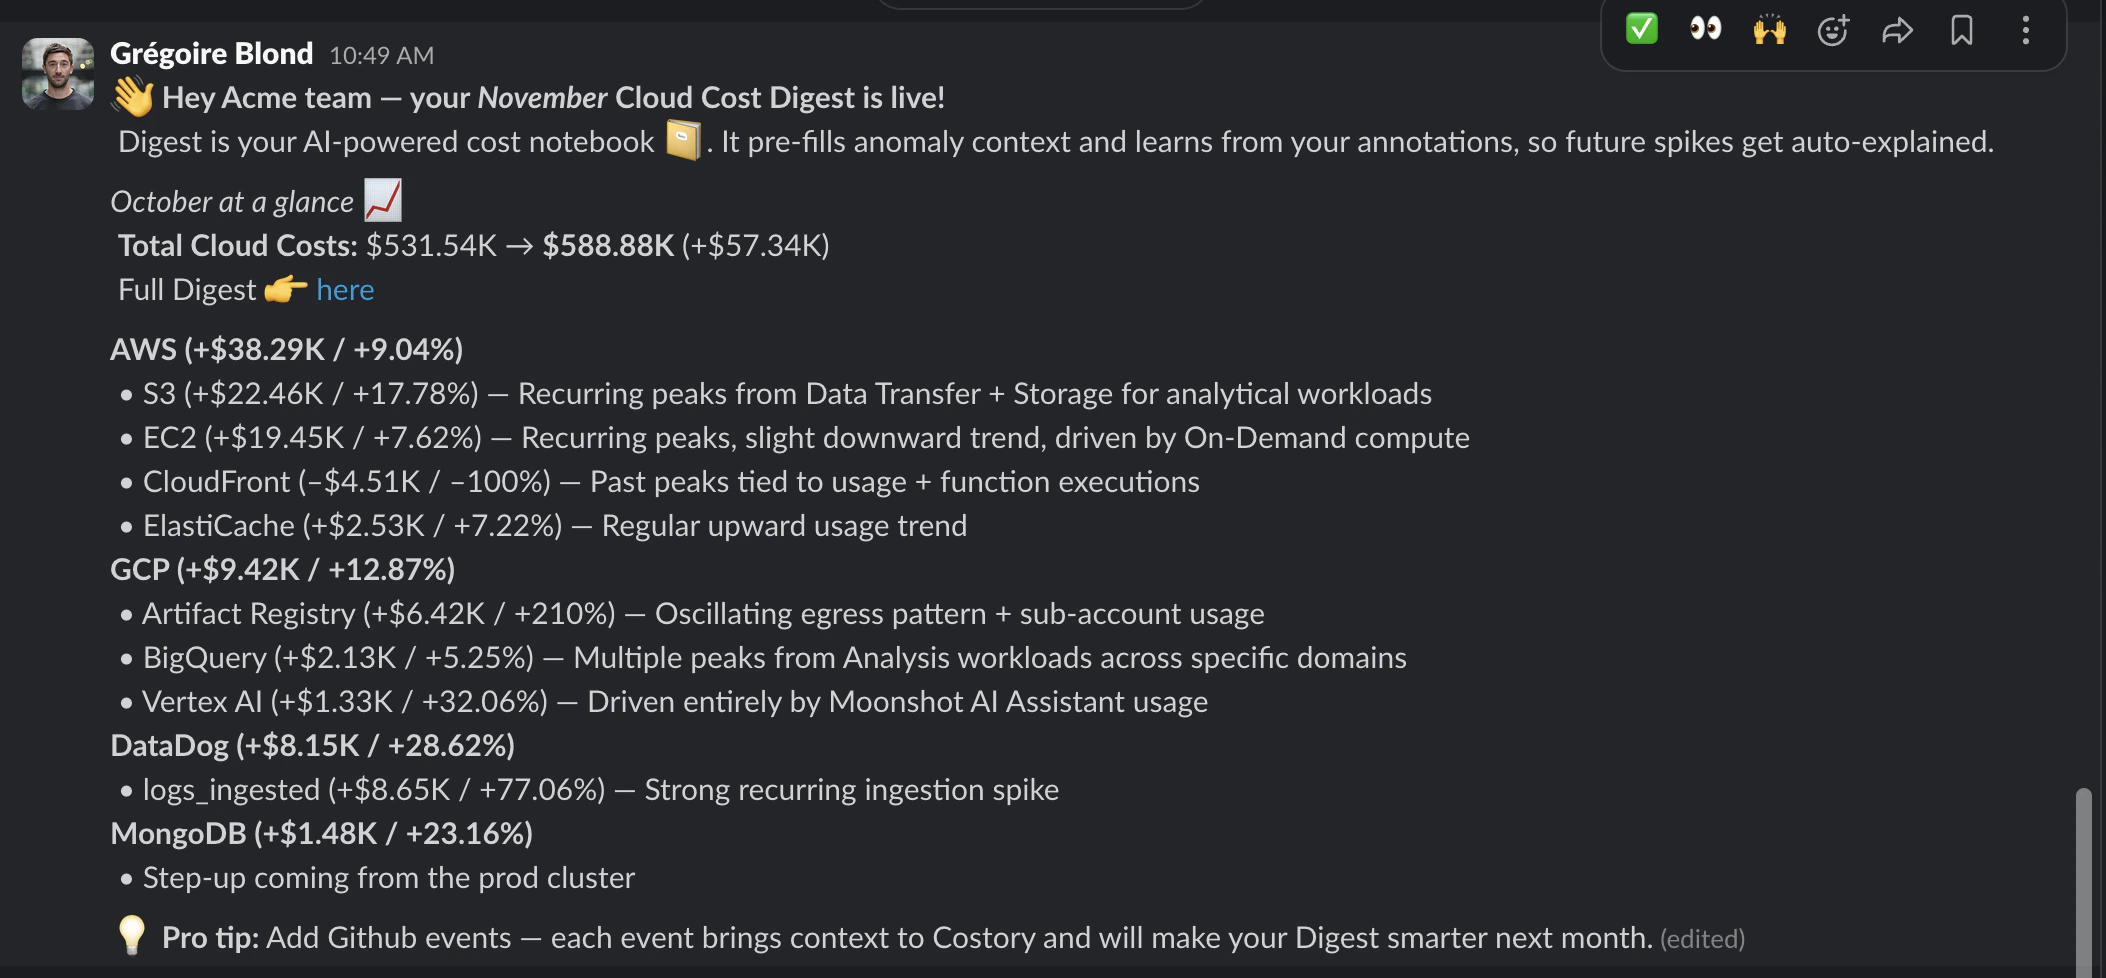
Create a chargeback-ready EKS view
Use one saved view as the source of truth for team reporting:- Filter to container infrastructure costs, then group by the normalized team label.
- Add a secondary group-by for
app,service, ornamespaceso teams can see their main cost drivers. - Use Contracted Cost when you want stable team-level reporting across Savings Plan movements.
- Save the view with a name like
EKS chargeback by team. - Schedule the view through Cost Reports or add it to a Dashboard.
Next steps
Explore costs by cluster and label
Use to drill into EKS costs by cluster, namespace, and label.
Set up Cost Reports
Turn saved views into a and share weekly or monthly updates.
Configure monthly cost summaries
Tune the so highlights what changed.
Measure Kubernetes efficiency
Quantify and track over-provisioned clusters.
FAQ
Do I need to install an agent on my cluster?
Do I need to install an agent on my cluster?
The option you choose determines agent requirements. AWS does not require an agent in your cluster. AWS-managed usage metrics require a collector or agent to send metrics from the cluster. Kubecost and OpenCost require an agent on each cluster.
How long does it take for EKS data to show up in Costory?
How long does it take for EKS data to show up in Costory?
Expect a 2-3 day delay after enabling and activating . The data must first appear in your , then be ingested by Costory. For Kubecost or OpenCost, timing depends on the S3 export schedule.
What labels should I standardize for chargeback?
What labels should I standardize for chargeback?
Start with
team, app or service, and env. Standardizing these labels across clusters gives you consistent and reporting.Why do some workloads show up as unallocated?
Why do some workloads show up as unallocated?
Unallocated costs usually mean the pod or underlying resource does not have the label you are grouping by, or the label has not appeared in the yet. Check the deployment labels, confirm the relevant are active, then wait for the next export.
Should I allocate EKS costs by requests or actual usage?
Should I allocate EKS costs by requests or actual usage?
Use requests when you want simple, stable allocation that reflects Kubernetes scheduling decisions. Use actual usage when you want allocation closer to what workloads consumed. Actual usage requires CloudWatch, Amazon Managed Service for Prometheus, or another usage data source.