
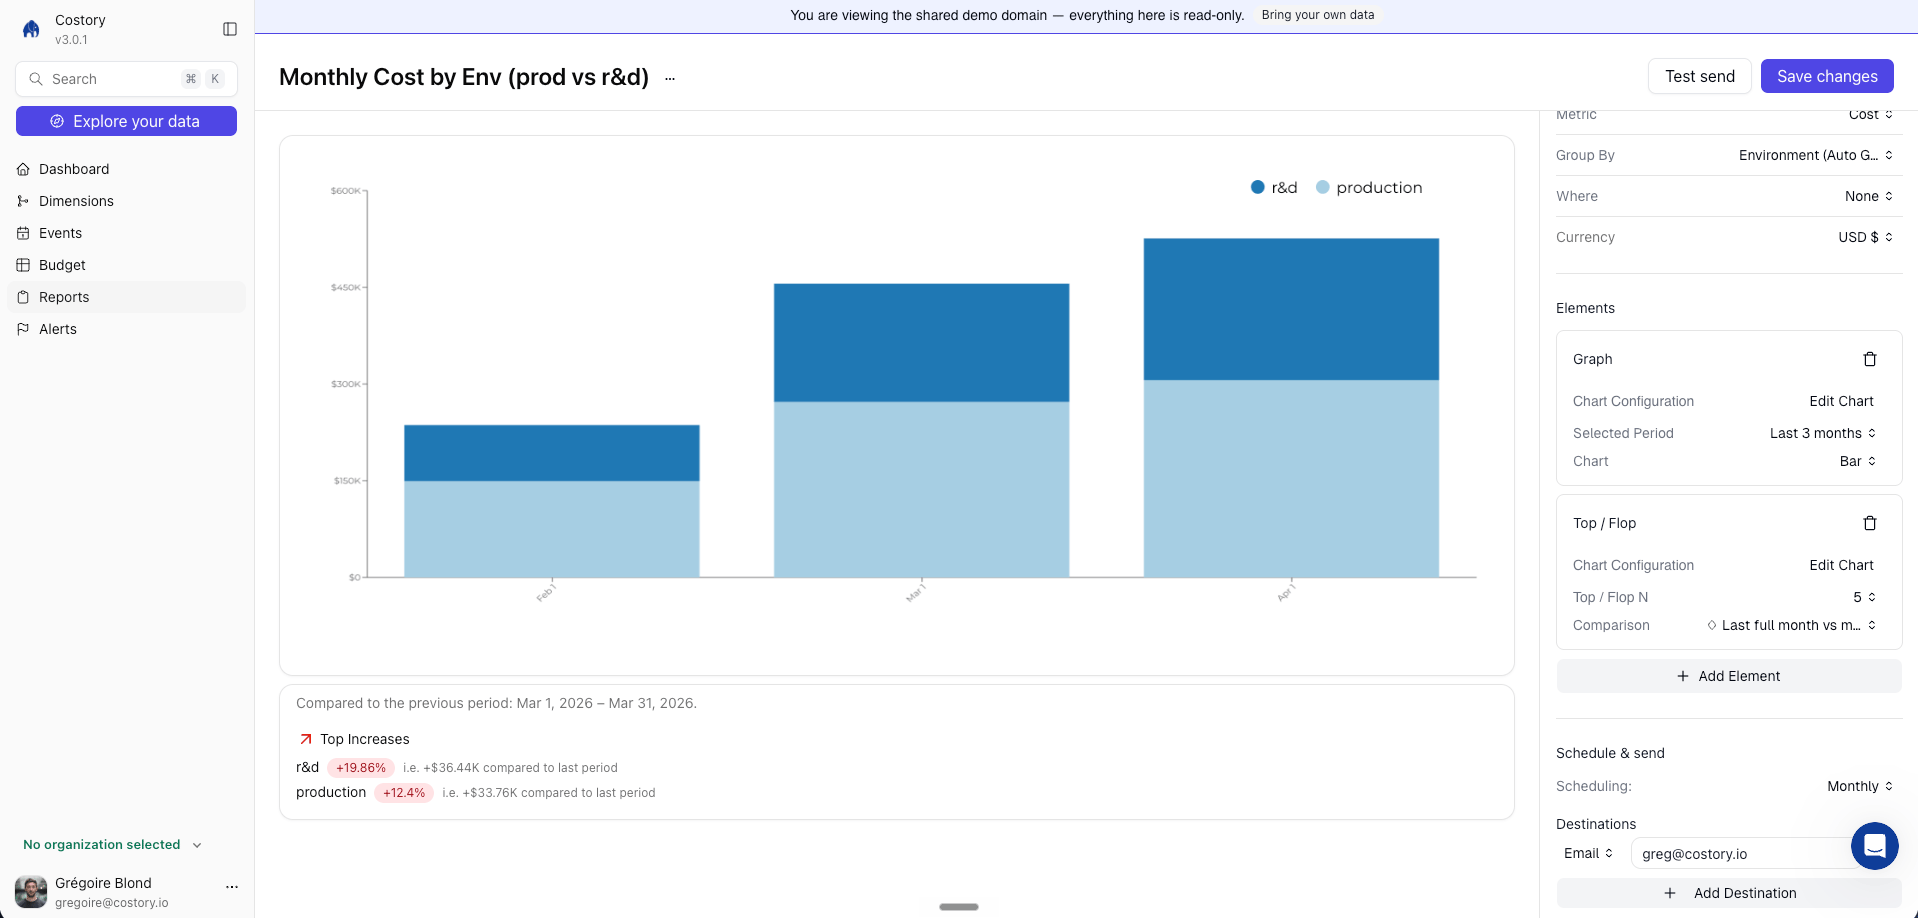
Monthly cost report configured with schedule, destinations, and period comparison
Overview
Cost Reports deliver a dashboard, dashboard widget, or Explorer-backed cost view as a formatted snapshot on a schedule you define. Each report includes the cost breakdown, a comparison against a previous period, and a direct link back to Costory. Where it fits in your day-to-day:- Sending weekly cost updates to each squad’s Slack channel so engineers see their infrastructure spend without logging into a dashboard
- Delivering monthly executive summaries to leadership with pre-filtered views scoped to their business unit
- Keeping SRE and platform teams informed about infrastructure cost trends as part of their existing review cadence
Get started
Click Schedule Report
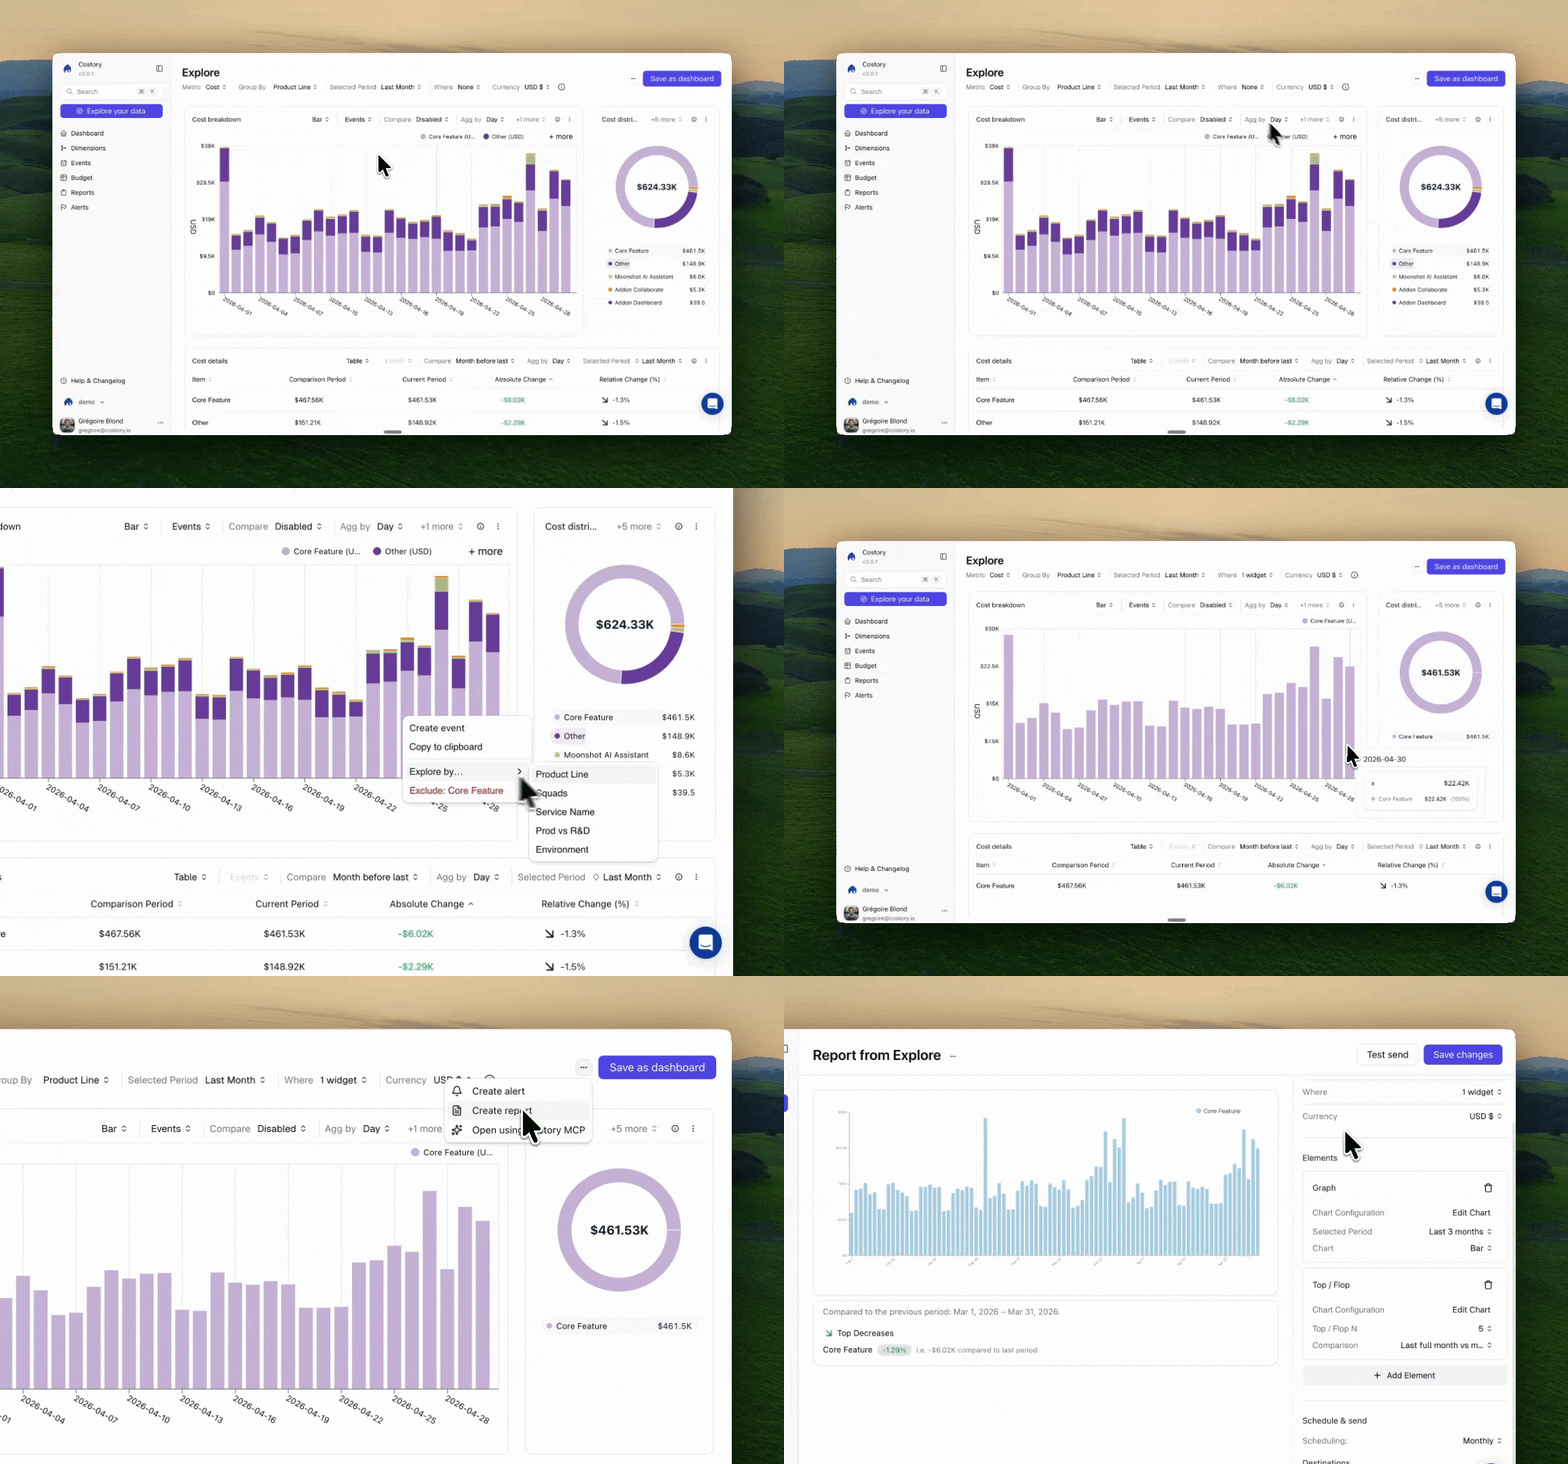
Scheduling a report from cost context in Costory
Choose a delivery channel
Confirm and send a test report
How a report is built
Every report combines the same building blocks, whether you assemble them in the UI, describe them to the Costory MCP, or send them to the Reports API:- A scope: the accounts, services, tags, or filters the report covers.
- A group-by: the dimension the cost is split by, such as service, environment, or vendor.
- One or more widgets: the charts rendered in the message.
- A cadence: weekly on a set weekday, monthly, or on-demand.
- One or more destinations: the Slack, Teams, or email targets it fans out to.
advancedExplorerRequest: a period, and a queries array holding the metric, group-by, and chart type to render.
What you can build
The building blocks above cover a wide range of reports. The examples below show the output, the sentence that creates it through the Costory MCP, and the equivalent Reports API call.advancedExplorerRequest.
Scope filters go in each query’s whereClause; the examples show the intended
filter as a comment. See Create a
report for the full schema, the list
of metrics and date presets, and a live playground.Weekly engineering pulse
Give each engineering team a weekly view of what moved. Group by environment, then by service, turn on the Digest AI narrative, and deliver it to the team’s channel every Monday. Engineers see which service drove the change and why, without opening a dashboard. See the Decentralize FinOps guide for a full walkthrough.
Weekly environment-to-service report with an AI narrative, delivered to an engineering Slack channel
Executive environment costs
Leadership usually wants one clean number per environment, not a drill-down. Build an environment that maps accounts, tags, and cluster labels to prod, staging, and dev, then schedule a monthly ranking of the top environments. Add a twelve-month trend to catch non-production creep, and deliver it to a leadership channel or mailing list. See Executive Cost Reports for more on building views for stakeholders.
Monthly environment ranking with a twelve-month trend, emailed to leadership
Kubernetes namespace showback
On shared clusters it is hard to tell which team drives the EKS or GKE bill. Scope a report to reallocated namespace cost, group by namespace, and send a weekly breakdown with a fourteen-week trend and the last week’s movers to the platform channel. This gives each team on shared infrastructure. A sudden drop is as useful as a spike, since it can mean a broken workload or a real saving.
Weekly per-namespace cost with a fourteen-week trend and last-week movers
Marketplace and vendor spend
Finance often needs to reconcile third-party software billed through the cloud invoice against purchase orders and renewals. Scope a report to marketplace purchases, group by vendor (the invoice issuer), and deliver a monthly ranking with a twelve-month trend to the finance or procurement channel. Native usage such as compute never enters the chart, so the vendor list stays clean.
Monthly marketplace-only spend ranked by vendor, with a twelve-month trend
Credit and discount runway
Committed-use discounts, savings plans, and promotional credits all settle on the monthly invoice, and a shrinking credit line is easy to miss until it is gone. Group a report by charge category to separate usage from credits, discounts, and refunds, and schedule it monthly. The last-month movers surface a credit that is running out before the real invoice arrives.
Monthly charge-category breakdown showing usage against credits and discounts
Tag coverage
When half the bill cannot be allocated, a tagging campaign needs a number the team can move. Track the share of in-scope cost that carries the required tag, grouped by service so the gaps point at an owner. The coverage ratio is a formula over two cost queries: tagged cost divided by all in-scope cost. Schedule it weekly during an active cleanup, then drop to monthly once coverage holds.
Weekly tag-coverage ratio by service, with the services carrying the most untagged spend
Explain a cost change on demand
Not every report is recurring. Before a finance review, you often need to explain a single number that moved. Send an on-demand report with a Digest widget that decomposes the change into drivers, for example compute in production up and a new database service added. Set the cadence to none and trigger it once with Run a report now.Build reports with the API
Everything above is available over HTTP through the Reports API. Authenticate with a bearer token as described in the API overview, then create a report in a single call, preview a widget before scheduling, or run one now. The Costory MCP and the UI both call the same endpoints, so a report built in chat can be edited by hand later, and the other way around.Frequently Asked Questions
Which delivery channels does Costory support?
Which delivery channels does Costory support?
Can I send different views to different channels?
Can I send different views to different channels?
How often can reports be sent?
How often can reports be sent?
Can I create reports from chat or the API?
Can I create reports from chat or the API?
POST /reports call, so a report you start in chat can be edited in the
UI or updated over the API.What's the difference between Cost Reports and Digest?
What's the difference between Cost Reports and Digest?
Is there a limit on the number of scheduled reports?
Is there a limit on the number of scheduled reports?