Query BigQuery tables live as external metrics in Costory Advanced Explorer. Grant dataset access, validate the project, then pick a table.
Query BigQuery tables live as external metrics in Advanced Explorer. Grant dataset-level access to the Costory service account, validate the project, then pick a table, date field, and value column. Costory does not copy table data.On Add integration, the GCP tile lists Any BigQuery table and Cloud Monitoring metrics. This page is BigQuery Metric. For live GCP infrastructure metrics, see GCP Cloud Monitoring.
See BigQuery integration and cost allocation in action
Connect GCP BigQuery: grant dataset access on the left, Connection details on the right
Manual setup
Terraform
1
Open the GCP tile
Go to Integrations, click + Add integration, then under External metric choose GCP. The connect URL is /integration/new/gcp/bigquery.
2
Grant dataset access
Copy the Costory service account from the connect screen. Open the BigQuery dataset you want Costory to read, share it with that account, and grant BigQuery Data Viewer and BigQuery Metadata Viewer on the whole dataset, not on individual tables. Project-level access is not required.These are the same roles used for GCP billing export.
3
Enter connection details
Set Connection name and GCP project ID. Click Validate, then Save connection.
This connector queries usage metrics from your BigQuery tables. To import GCP billing data, use GCP Billing Setup. To export Costory dashboard data to your own BigQuery project, see BigQuery Data Exports.
An EU organization can use a US dataset if it has an EU replica. Analytics Hub linked datasets in the project are included. Share the linked dataset, not the publisher dataset.
Tables must be in the same region as your Costory workspace. Costory uses EU by default and US for US-based organizations. Multi-region locations (EU, US) work. Single-region datasets are not supported because BigQuery can only query tables in the exact same location. Replicate data to EU or US with BigQuery data replication if needed. An EU organization can use a US dataset if it has an EU replica.
Numeric column
At least one numeric column, such as FLOAT64, NUMERIC, or BIGNUMERIC.
Date column
At least one date or timestamp column: DATE, DATETIME, or TIMESTAMP.
Queries run live. Costory does not copy table data.
1
Open Advanced Explorer
Click Explore your data, then switch Classic to Advanced. Classic greys out non-cost metrics.
2
Add the BigQuery metric
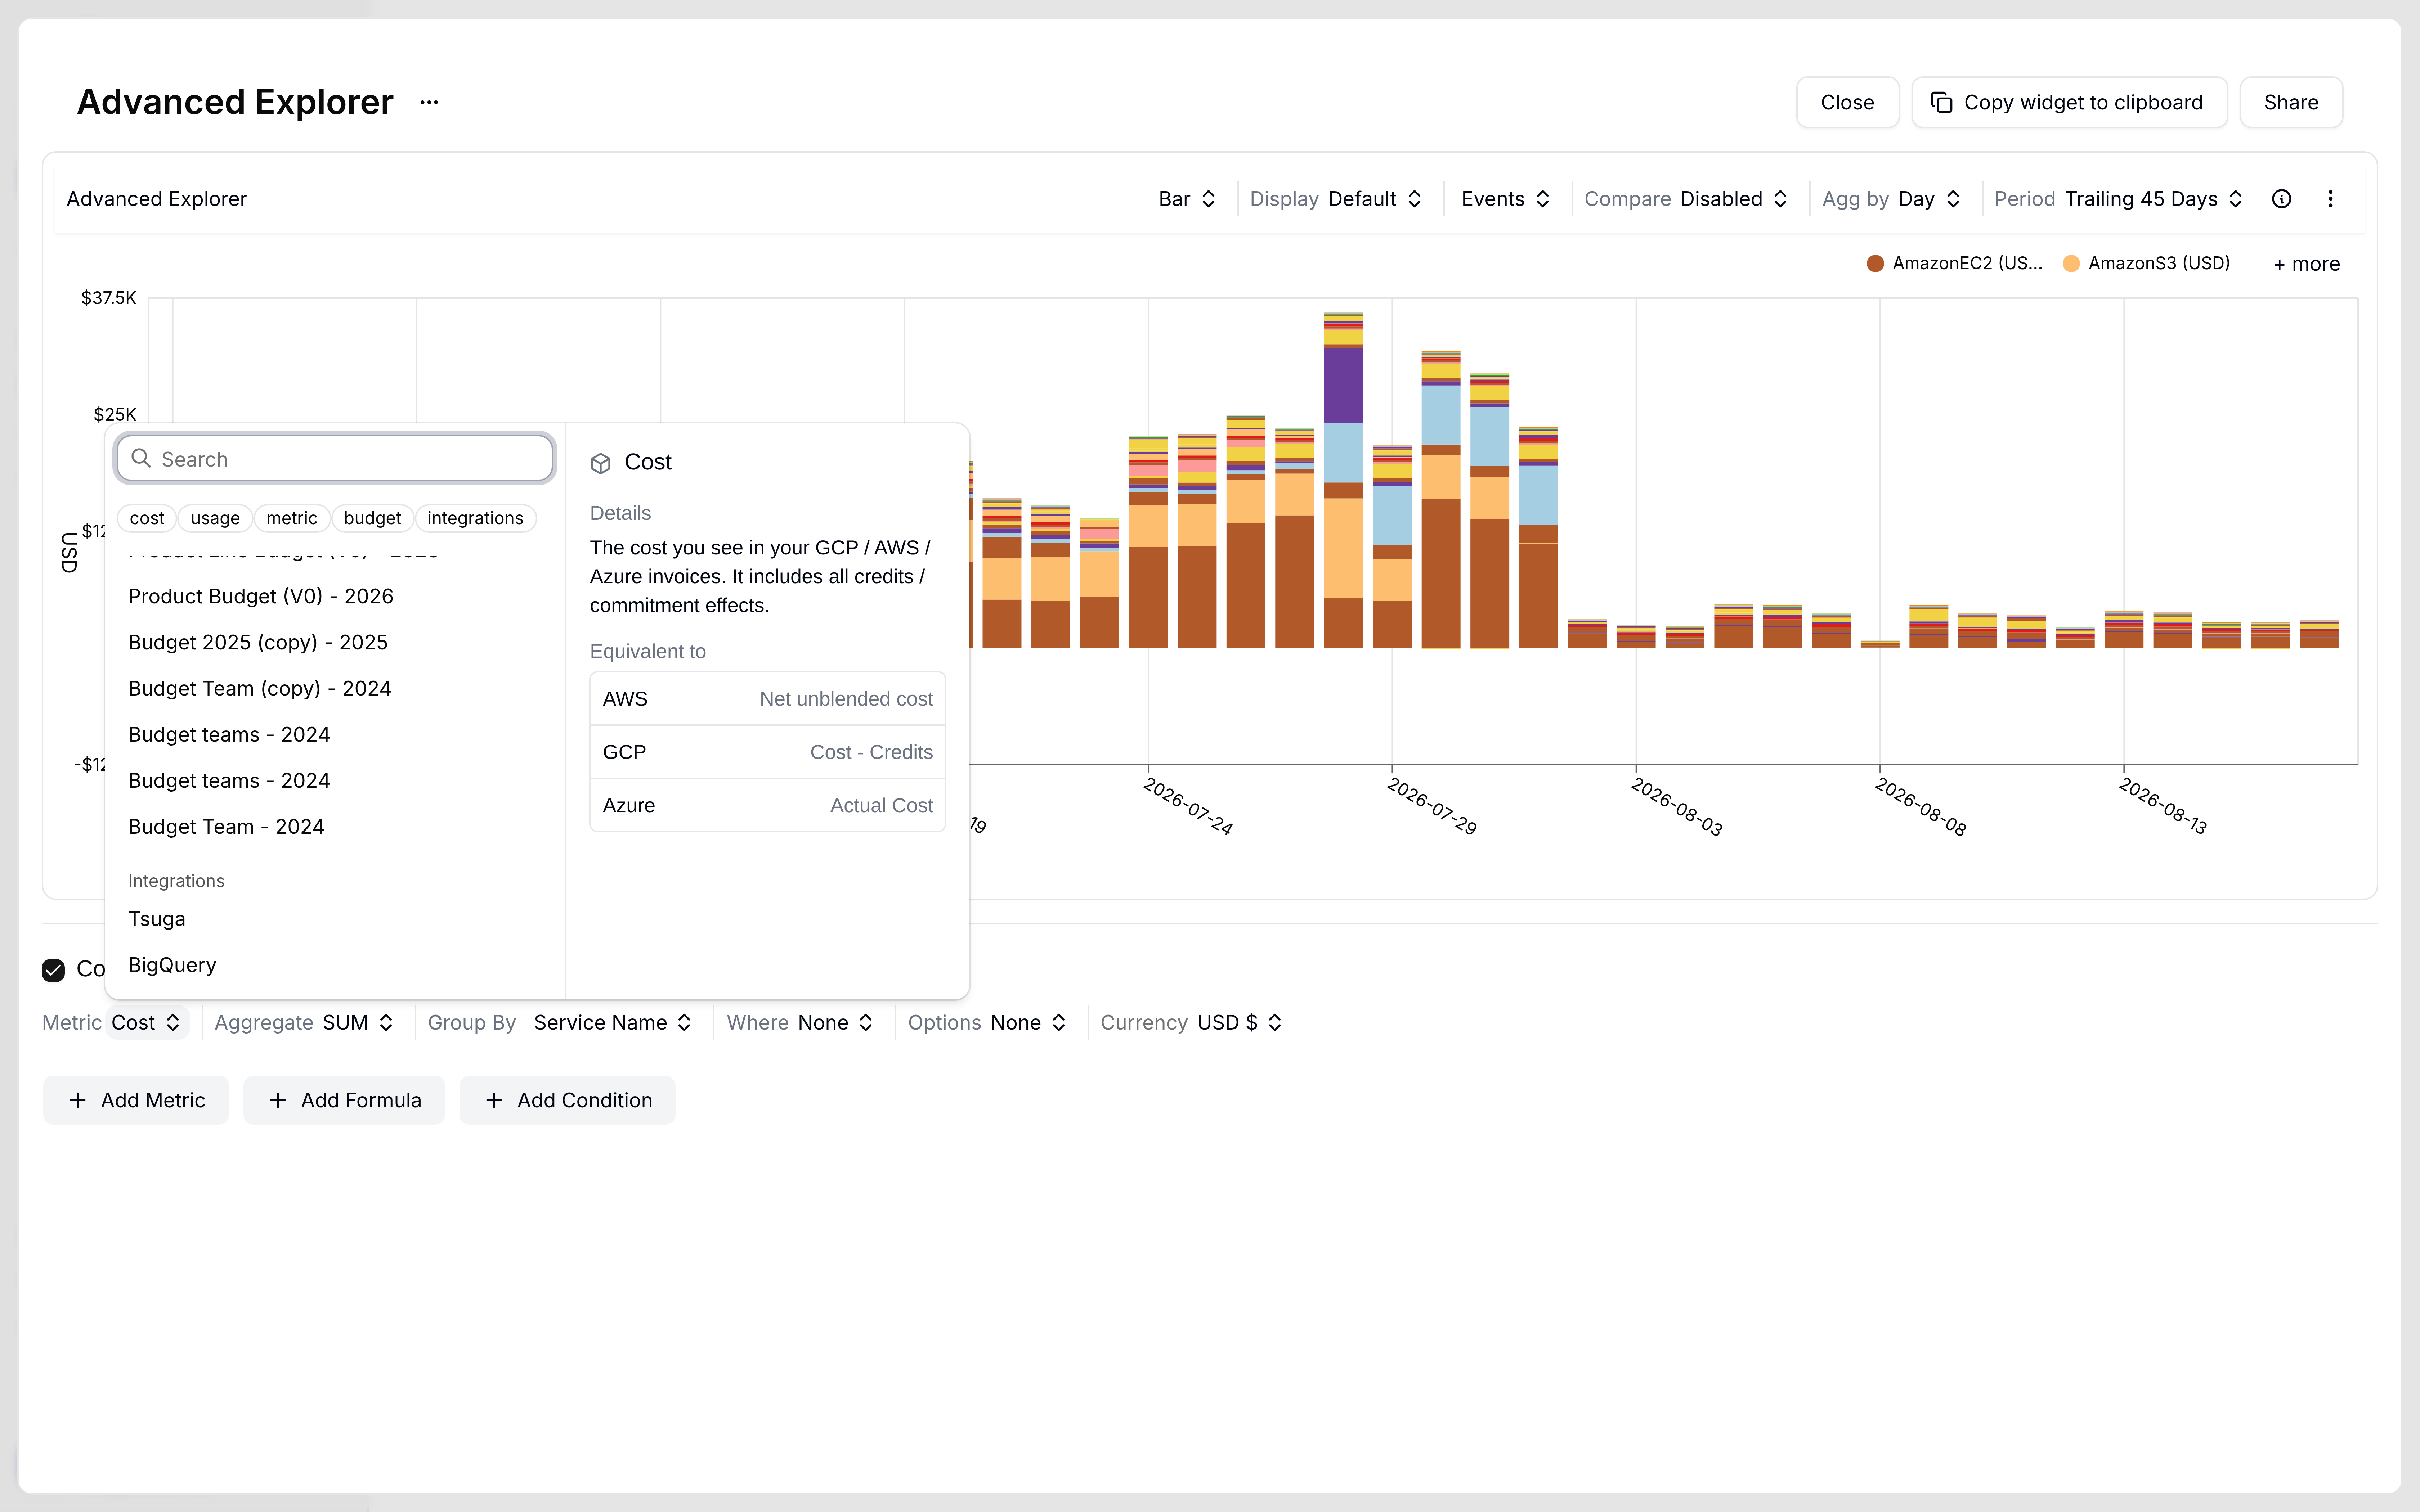
Click + Add Metric. Use the integrations chip, then pick BigQuery. Helper text describes it as a live external usage metric.
Metric picker chips: cost, usage, metric, budget, and integrations
3
Choose a table and columns
Pick a table from the picker, then set Date field, Value column, Aggregate (SUM), Gap fill (FORWARD FILL, ZERO, or LINEAR), and optional Group by.
BigQuery table picker after you select the BigQuery integration
4
Fix an empty chart
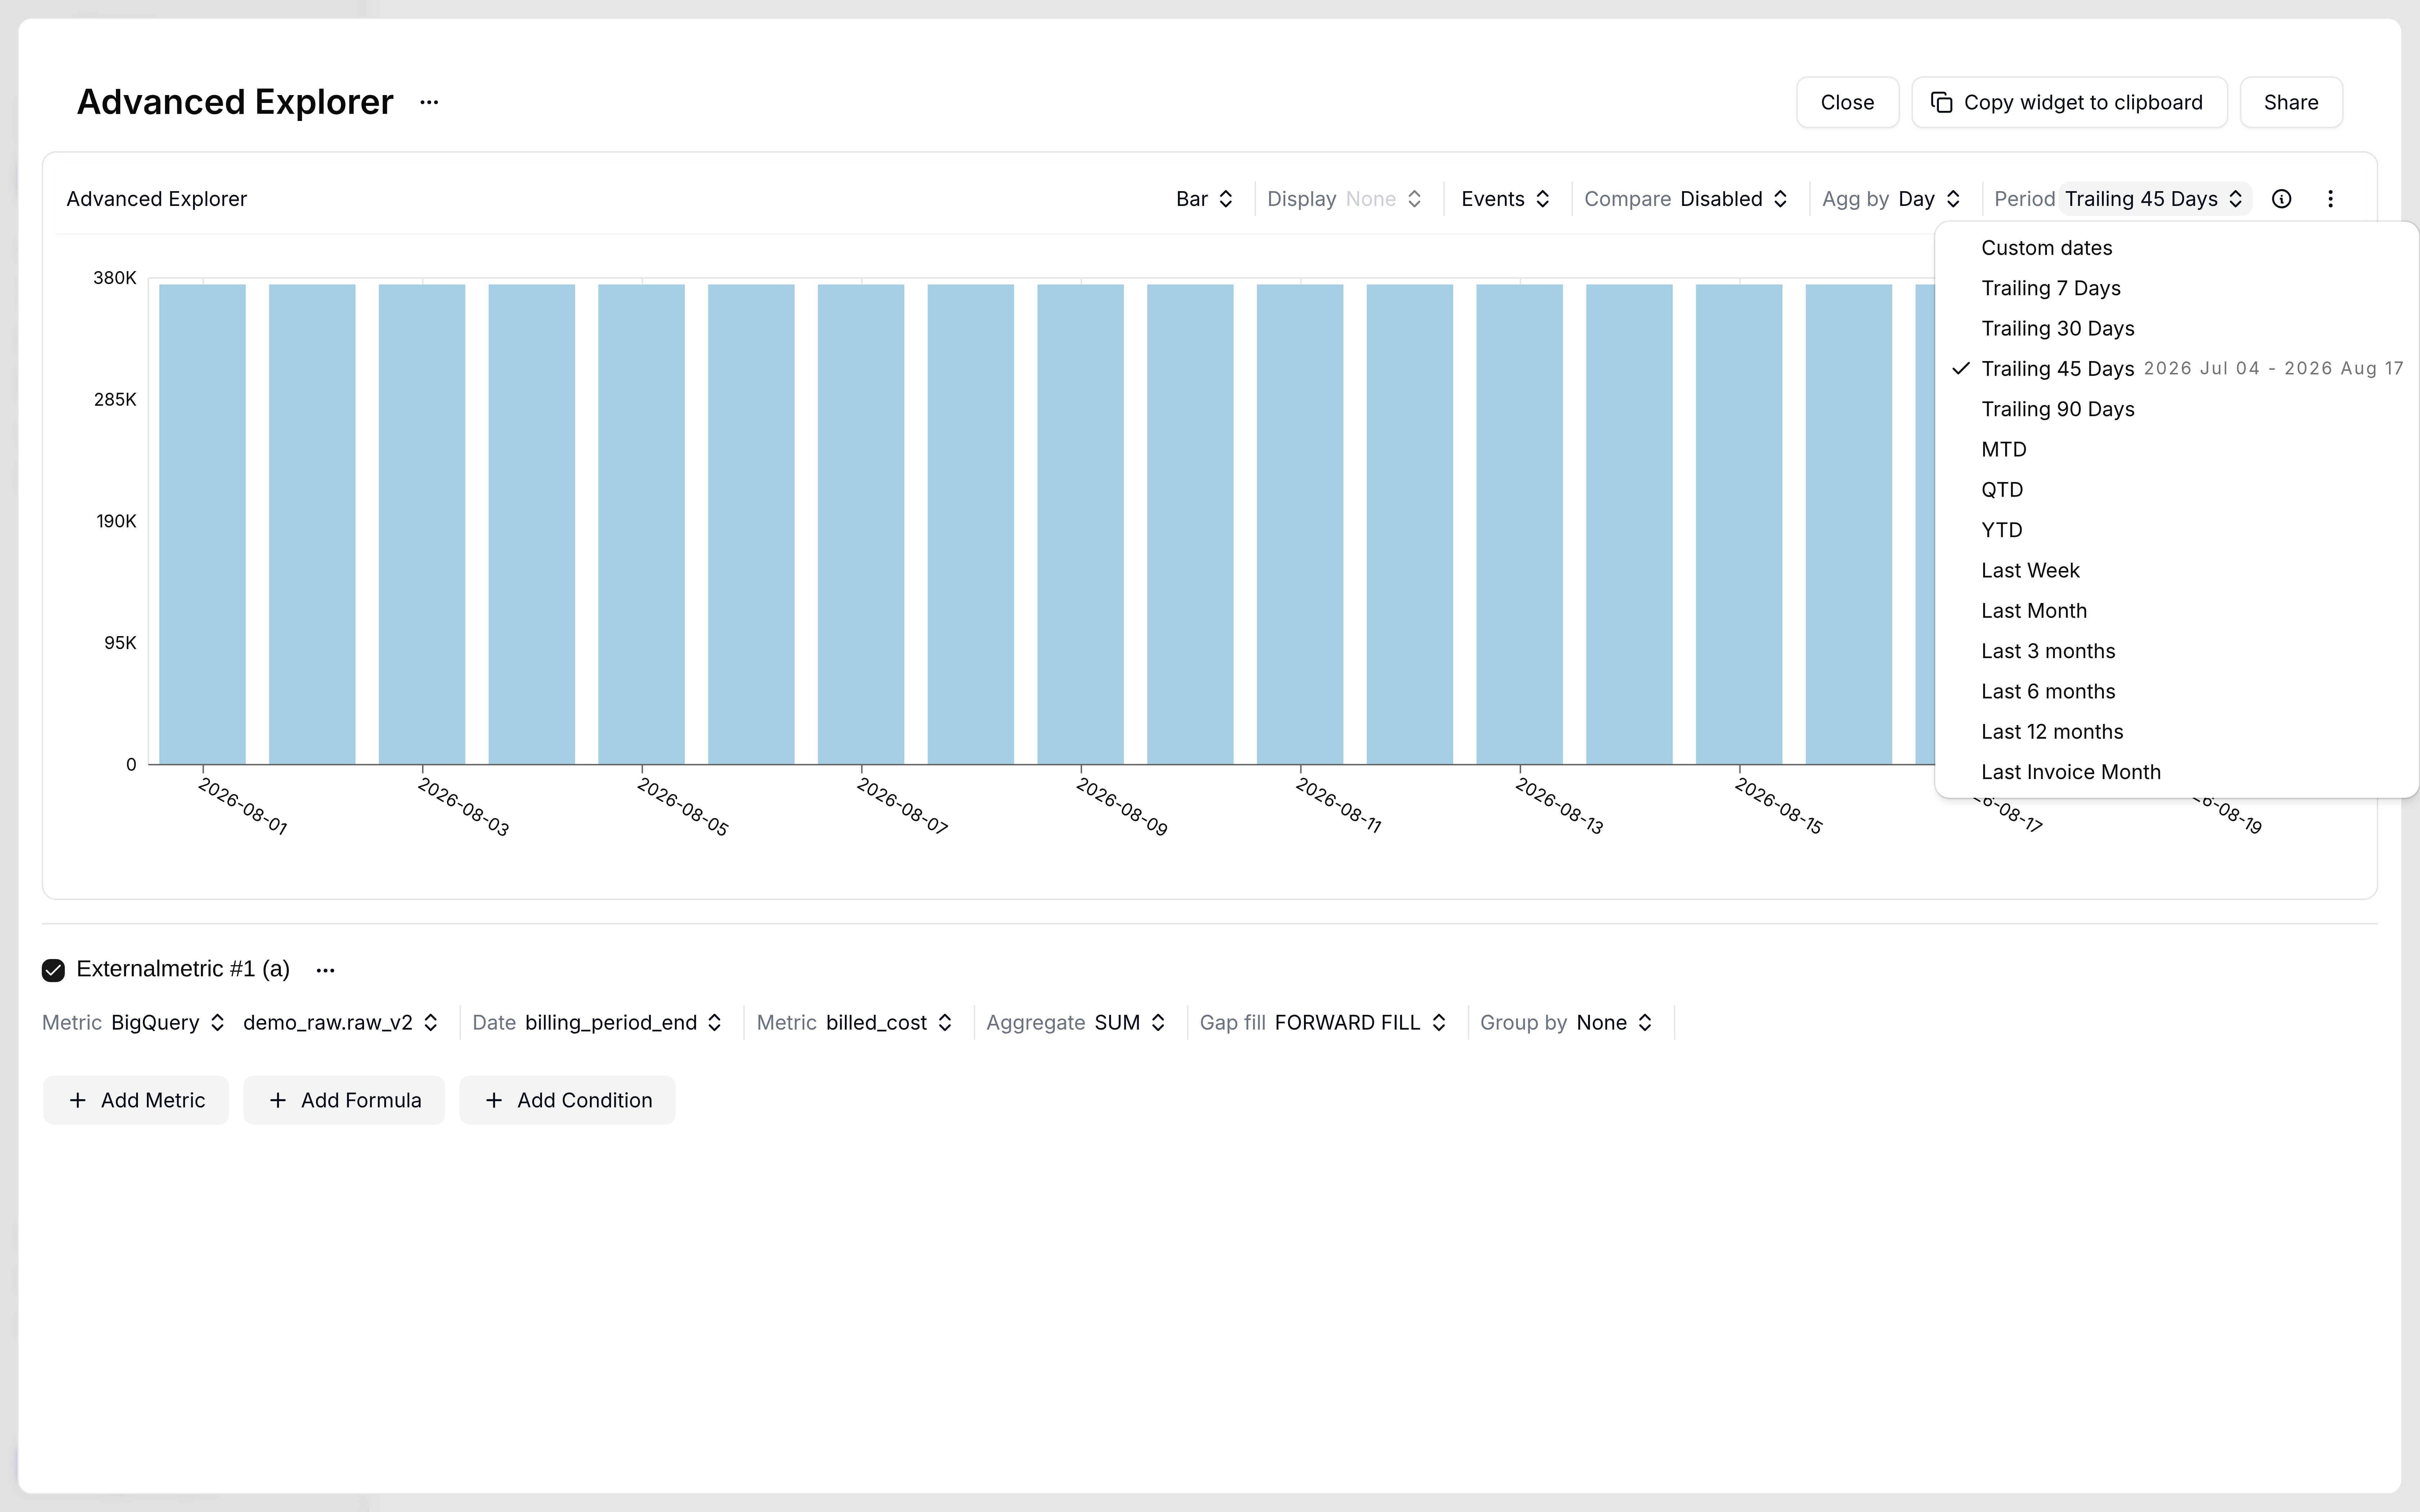
If the chart is empty, pick a different table and change Period. Options include Custom dates, Trailing 7 / 30 / 45 / 90 Days, MTD, QTD, YTD, Last Week, Last Month, Last 3 / 6 / 12 months, and Last Invoice Month.
Period dropdown with Trailing 45 Days selected
In the demo workspace, demo_raw.artifact_* tables stayed empty at every range. demo_raw.raw_v2 with Trailing 90 Days rendered using date billing_period_end, value billed_cost, SUM, and FORWARD FILL.
External metric chart for demo_raw.raw_v2 with billed_cost SUM and FORWARD FILL
5
Add cost or a formula
Optionally click + Add Metric for Cost, then + Add Formula such as b / a.
Confirm the dataset is shared with the Costory service account on the whole dataset, the table has both a date and numeric column, and the dataset region matches your Costory workspace (or has an EU replica for an EU org). For Analytics Hub, share the linked dataset, not the publisher dataset.
Chart is empty
Pick a different table and change Period. In the demo workspace, demo_raw.artifact_* stayed empty. demo_raw.raw_v2 with Trailing 90 Days rendered.
Wrong date or value column selected
Open the metric configuration and pick the correct columns.