Connect AWS CloudWatch to import custom usage metrics, such as S3 storage size, request counts, CPU usage, or queue depth. Costory pairs these with billing data so you can build unit economics.
-
Create an AWS CloudWatch integration in Integrations:
a. In AWS, attach the following policy to the existing federated IAM role that Costory uses:
{
"Version": "2012-10-17",
"Statement": [
    {
    "Sid": "CloudWatchReadForCostory",
    "Effect": "Allow",
    "Action": [
        "cloudwatch:ListMetrics",
        "cloudwatch:GetMetricData",
        "cloudwatch:GetMetricStatistics"
    ],
    "Resource": "*"
    }
]
}
-
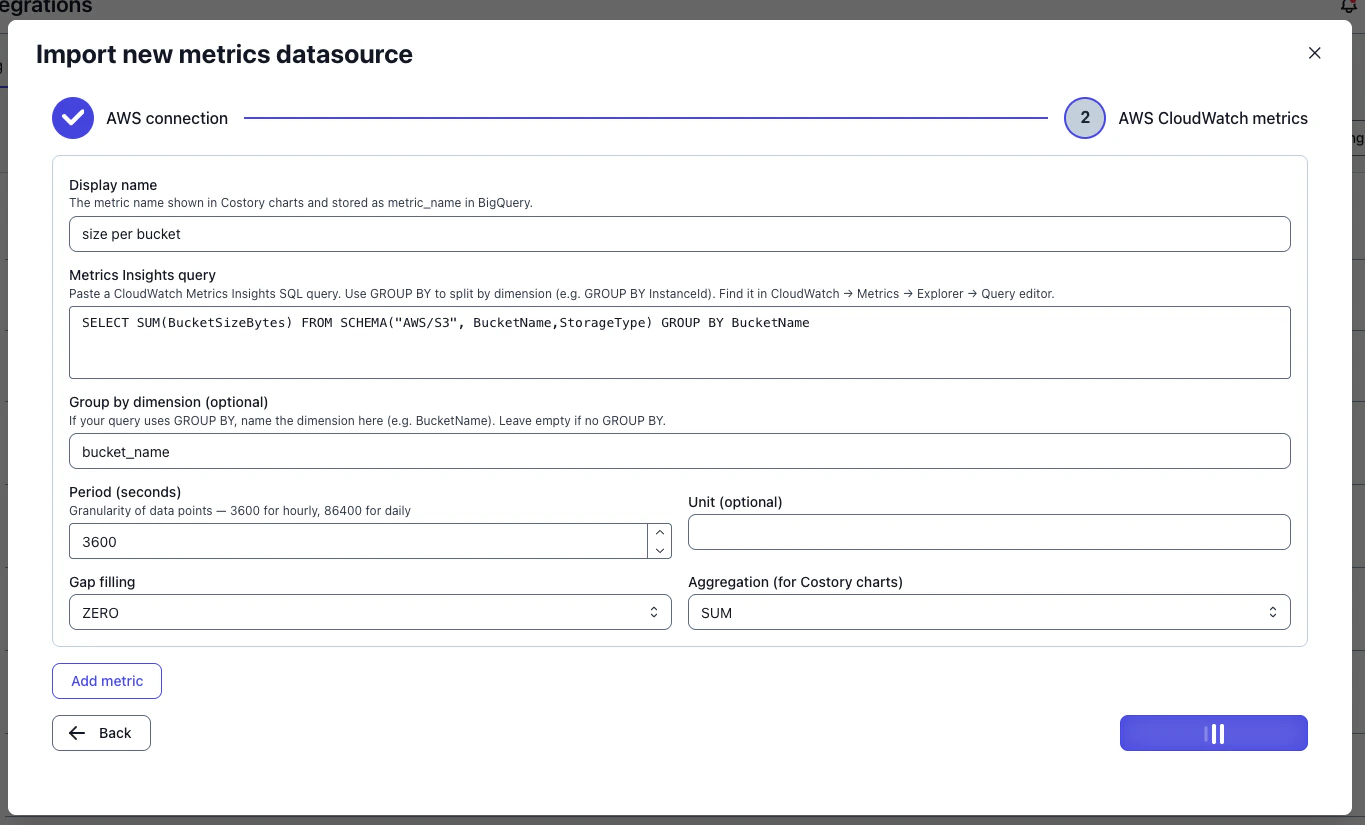
In Costory, go to Metrics > Import new metrics datasource > AWS CloudWatch.
-
Provide the CloudWatch query, aggregation, and optional group-by fields.
a. You should import the metric as an AWS CloudWatch insight query:
SELECT SUM(BucketSizeBytes) FROM SCHEMA("AWS/S3", BucketName,StorageType) GROUP BY BucketName
- S3 storage size: total bytes per bucket (
AWS/S3 BucketSizeBytes)
- HTTP request volume: number of requests per API, ALB, or distribution (e.g.
AWS/ApiGateway, AWS/ApplicationELB, AWS/CloudFront)
- CPU and memory utilization: average CPU/memory by service, cluster, or Auto Scaling group (
AWS/EC2, AWS/ECS, AWS/EKS)
- Queue depth and throughput: SQS queue length, messages sent/received (
AWS/SQS)
- Database load: connections, CPU, IOPS for RDS or Aurora (
AWS/RDS)
Terraform support for AWS CloudWatch usage metrics is not available yet. If you want to manage this integration as code, contact us so we can prioritize it.
Last modified on June 30, 2026
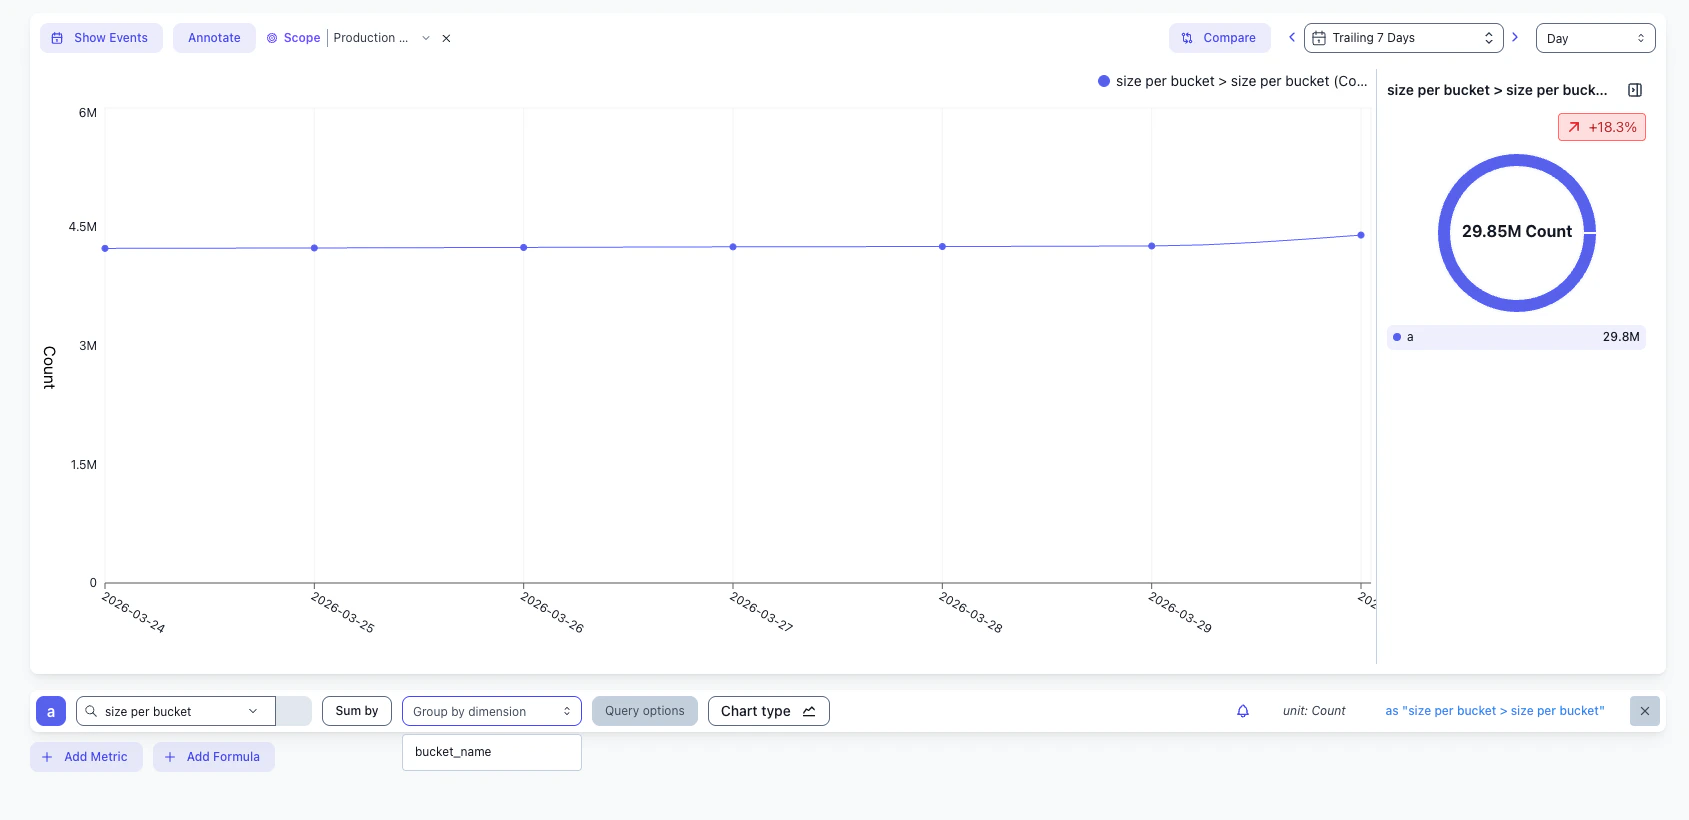
 b. After a few seconds, the metric will be available in Costory. Common examples you can import: