
Add integration External metric tiles, including GCP
- Manual setup
- Terraform
1
Open Cloud Monitoring
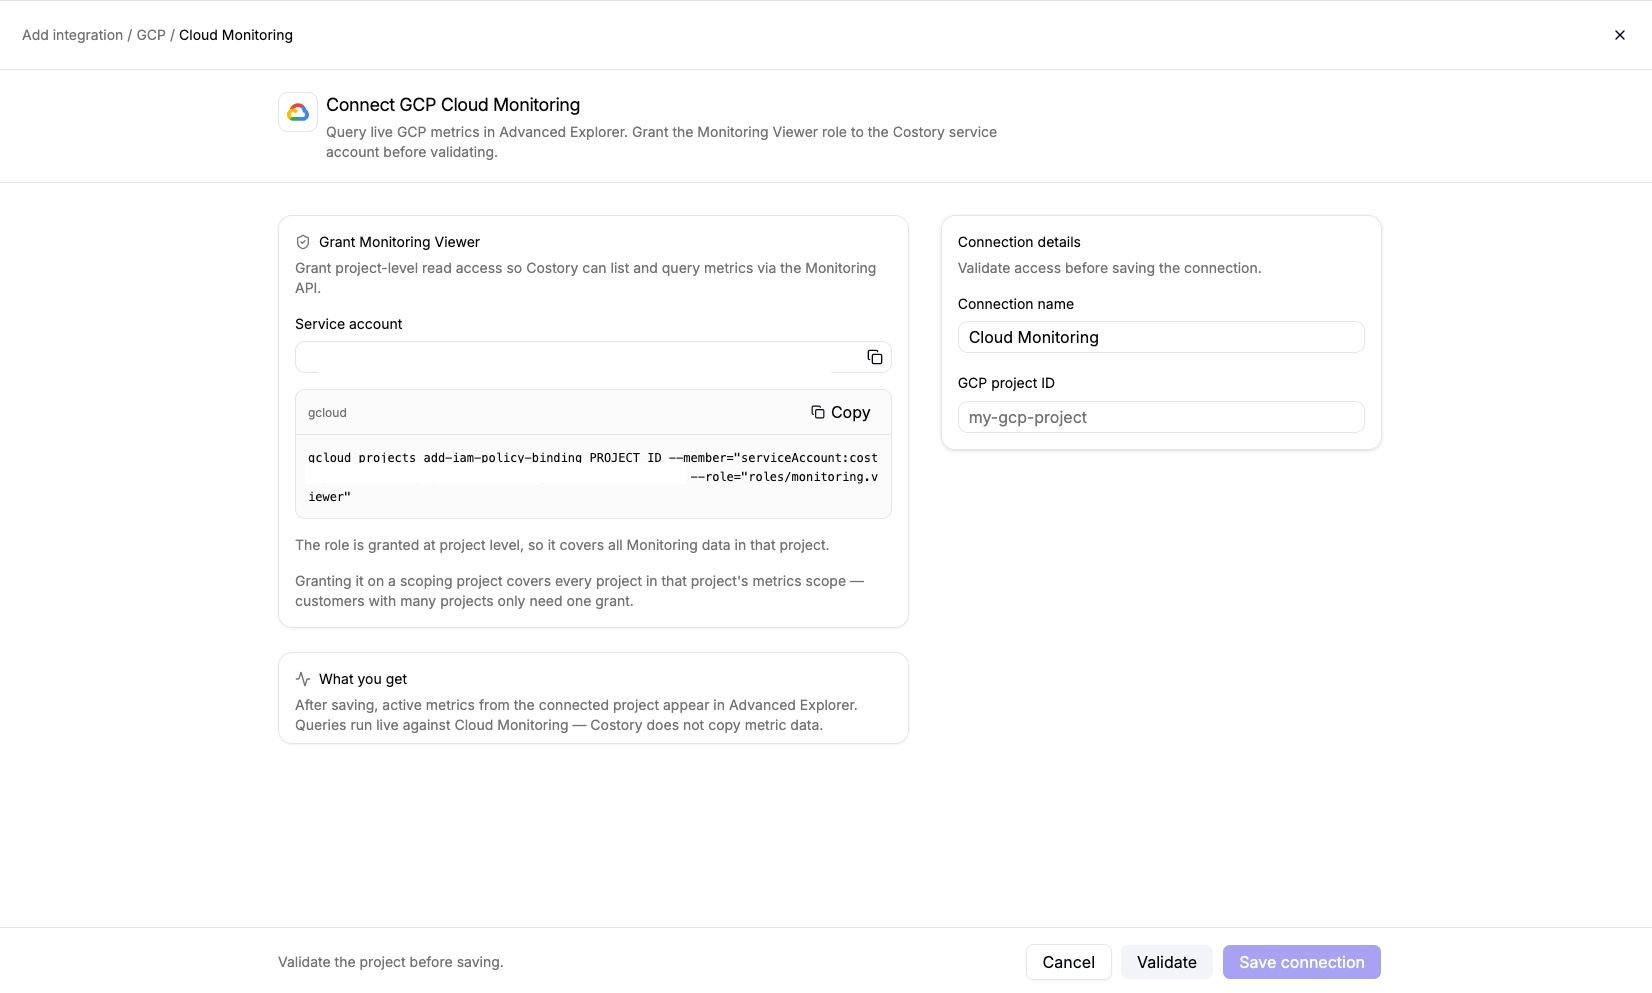
Go to Integrations, click + Add integration, then under External metric choose GCP. On Choose what to connect, pick Cloud Monitoring. The connect URL is
/integration/new/gcp/cloud-monitoring. You need to be an admin. 2
Grant Monitoring Viewer
Copy the Service account from the connect screen. Grant project-level Monitoring Viewer (The GCP project ID you enter updates the command on the page.
roles/monitoring.viewer) so Costory can list and query metrics. The role is read-only. It covers every Monitoring series in that project. You cannot scope it to a single metric.Run the command shown under gcloud, or paste this and replace the placeholders:3
Enter connection details
Set Connection name (default Cloud Monitoring) and GCP project ID. Click Validate. Costory lists active metrics in the project’s metrics scope and shows a count such as Found 42 active metrics in this project’s metrics scope. Click Save connection.Save connection stays disabled until validation succeeds.
4
Query in Advanced Explorer
Click Explore your data, switch Classic to Advanced, then + Add Metric. Open integrations and pick the Cloud Monitoring source. Search a metric type. The picker shows the path after the service domain, for example
instance/cpu/utilization for compute.googleapis.com/instance/cpu/utilization.See Query after you connect.Enable the Cloud Monitoring API (
monitoring.googleapis.com) on the project before you validate. A disabled API fails with a permission-style error.Connection fields
What you can query
After you save, active metrics from the connected project appear under integrations. Queries run against Cloud Monitoring. Costory does not store the timeseries.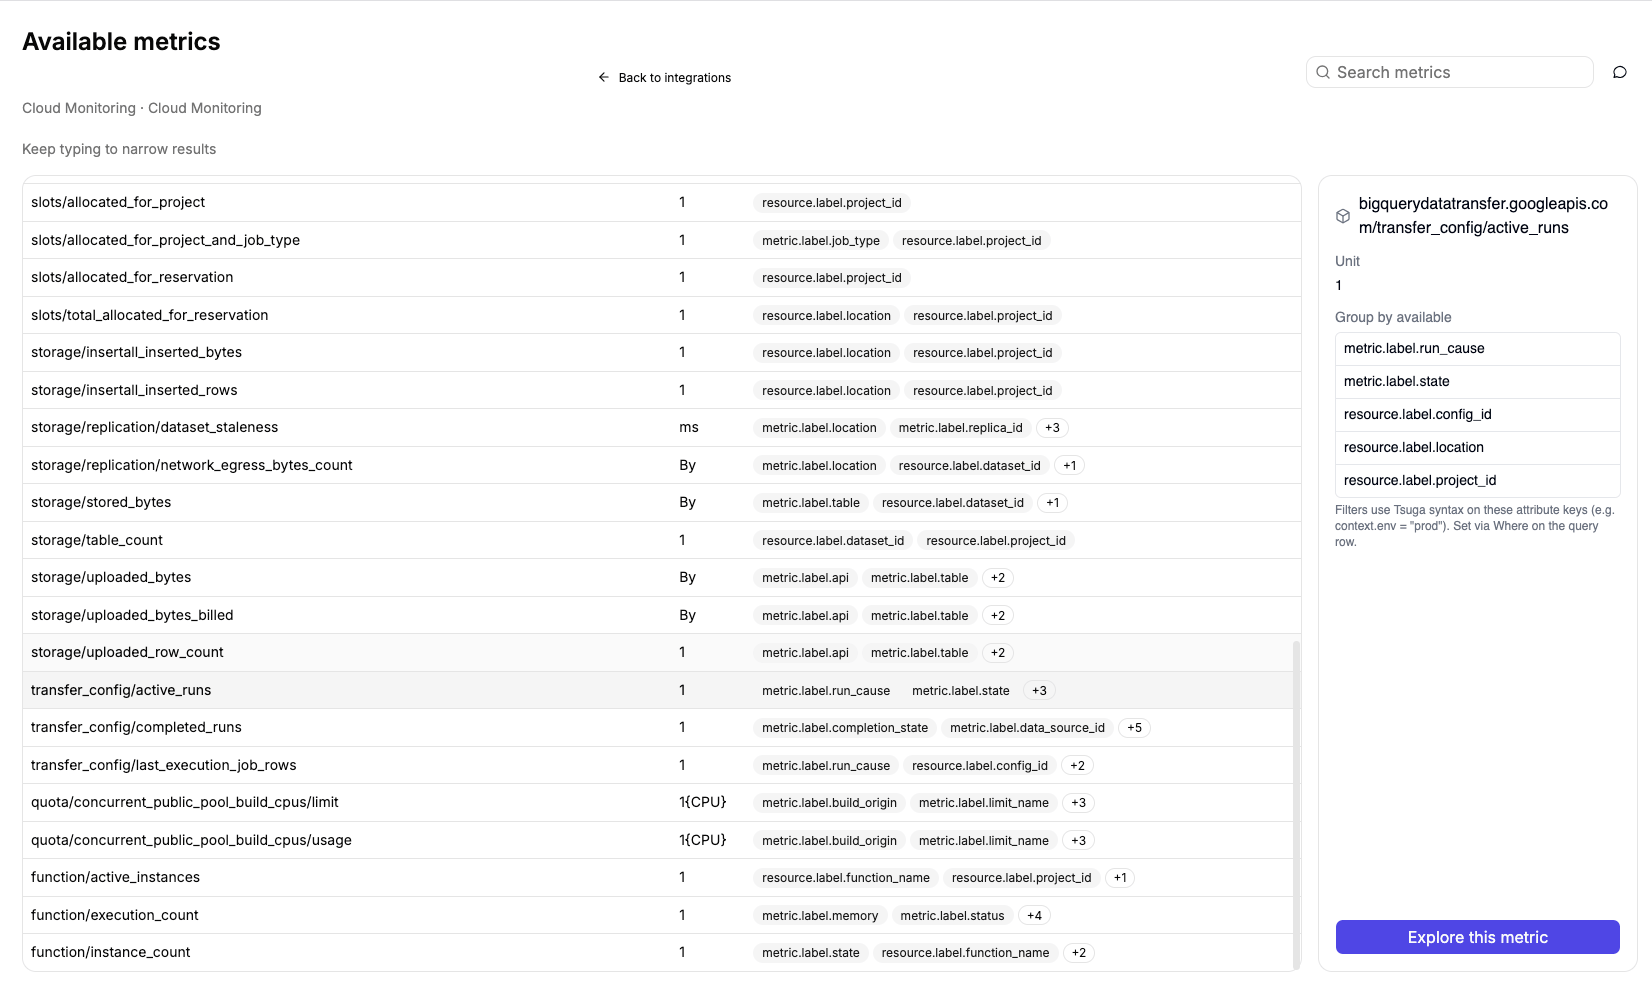
Google Cloud Monitoring metrics picker
- Compute Engine CPU utilization (
compute.googleapis.com/instance/cpu/utilization) - GKE container CPU request utilization (
kubernetes.io/container/cpu/request_utilization) - Cloud Storage object or byte counts (
storage.googleapis.com) - Cloud SQL connections or PostgreSQL insights execution time (
cloudsql.googleapis.com) - Custom or Prometheus metrics you already export to Cloud Monitoring
metric.label.* or resource.label.*. resource.label.project_id is always available.To narrow the series, paste a Cloud Monitoring filter in the condition field. The field is not validated in the UI. Example:Limits
Troubleshooting
Related pages
BigQuery metrics
Query a table instead of the Monitoring API on the same GCP tile.
BigQuery jobs (beta)
Reallocate slots to the user who ran the query.
Metrics Correlation
Query external metrics in Advanced Explorer.
Unit Economics
Divide cloud cost by a Cloud Monitoring series.
GCP Billing
Connect Detailed Usage Cost export for GCP spend.