When to use templates
Use a template when you want a working dashboard without deciding every widget first. After creating the dashboard, edit any widget to change the metric, chart type, filter, group-by, or date range. Templates are useful for:- Creating a repeatable dashboard for each team or product line
- Starting a monthly cost review without rebuilding the same charts
- Monitoring commitment coverage, Kubernetes costs, or network costs with standard FinOps views
- Giving executives a concise page with top cost drivers and budget movement
Available templates
| Template | What it tracks |
|---|---|
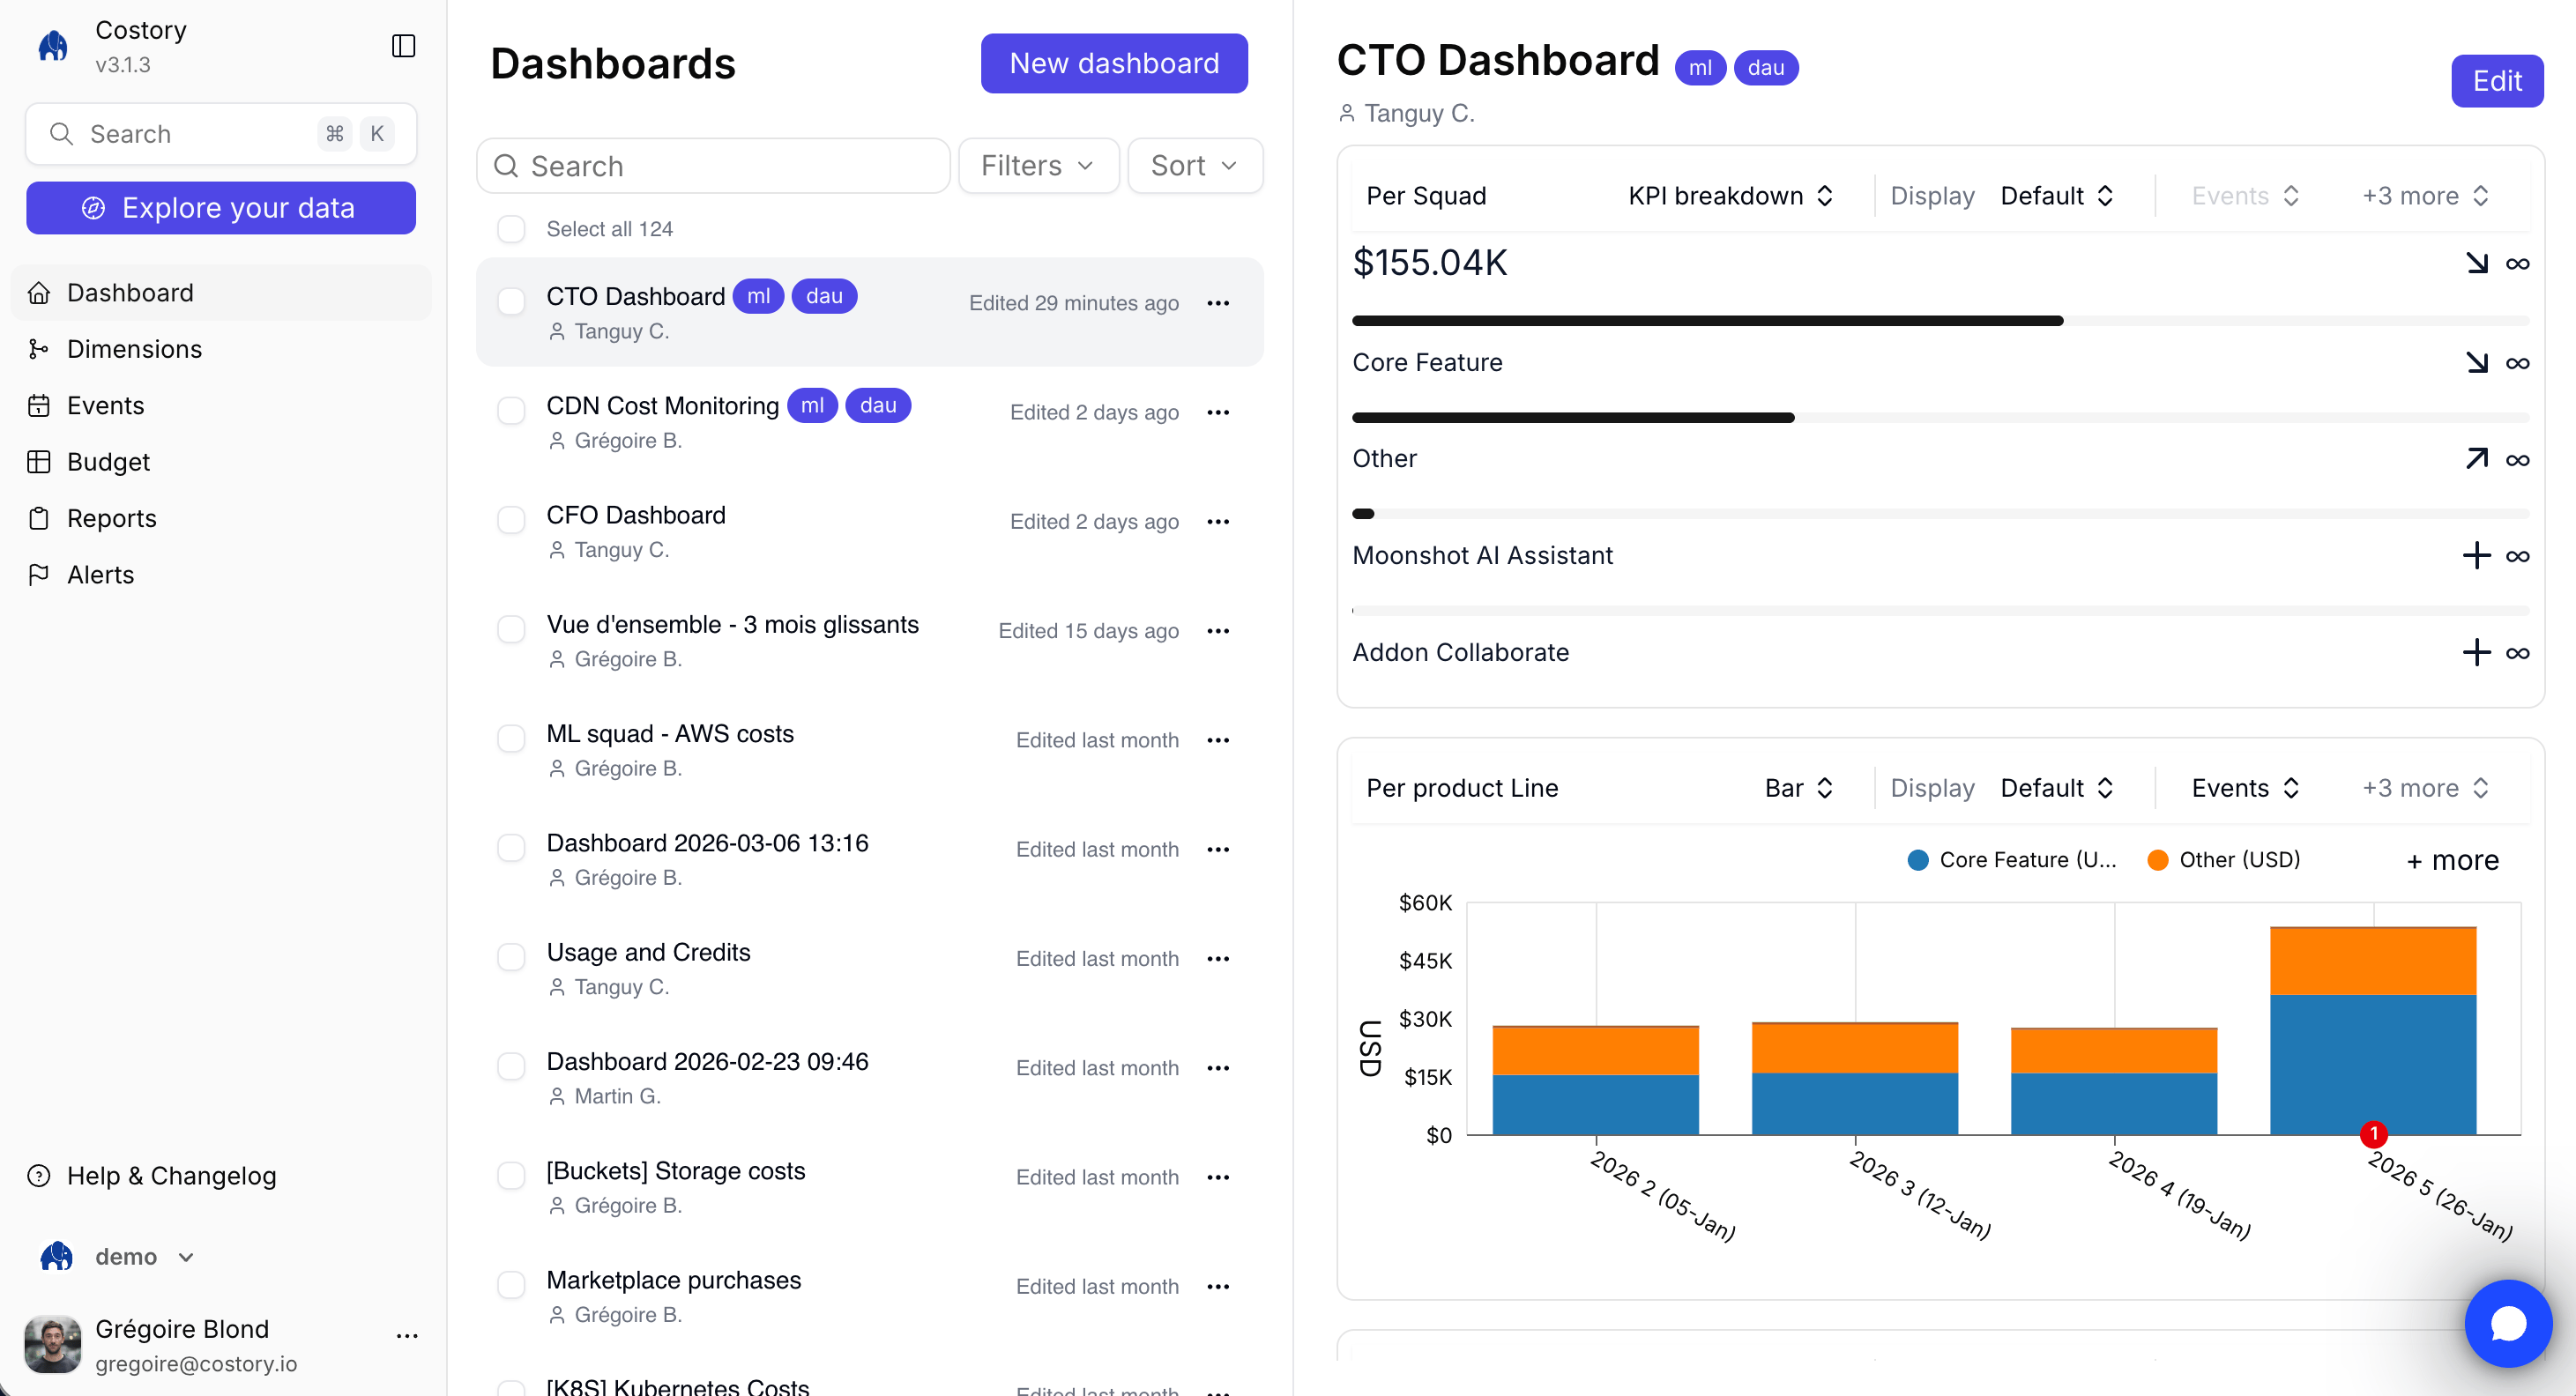
| CTO / Executive overview | Total spend trend, top cost drivers, budget progress, and month-over-month comparison |
| Team cost overview | Per-team spend scoped by dimensions, service breakdown, budget progress, and cost efficiency metrics |
| Savings Plan and CUD coverage | Covered vs uncovered spend, utilization rate, and coverage trend for commitment planning |
| Kubernetes cost breakdown | Cost by cluster, namespace, workload, and waste indicator. See EKS cost allocation. |
| Network cost analysis | Cross-AZ, egress, and transfer cost drivers by provider, service, account, or team |
| BigQuery cost attribution | BigQuery spend by project, dbt model, package, or team. See BigQuery and dbt visibility. |
| Storage cost optimization | Unattached volumes, underused disks, backup growth, and high-cost storage classes |
Create a dashboard from a template
Review the generated dashboard
Costory creates the dashboard with widgets populated from your connected billing data.
Apply team scopes
Team templates work best when your dimensions already map cloud resources to owners. Create one team dashboard, verify the layout, then duplicate it and swap the team filter for each additional team. You can also use Teams to assign dashboards to team members and apply default scopes.Template follow-ups
After you create a template dashboard, you can:- Add or replace widgets with dashboard widgets
- Send a public link with Quick Share
- Schedule the dashboard as a Cost Report
- Create an alert from the same query logic when a KPI needs monitoring
Related links
Create and organize dashboards
Build dashboards from Explorer or an empty canvas.
Widgets and chart types
Customize the widgets created by a template.
Dimensions
Configure team, product, or environment groupings before using team templates.
Kubernetes Cost Visibility
Break down Kubernetes costs by namespace, workload, and pod.